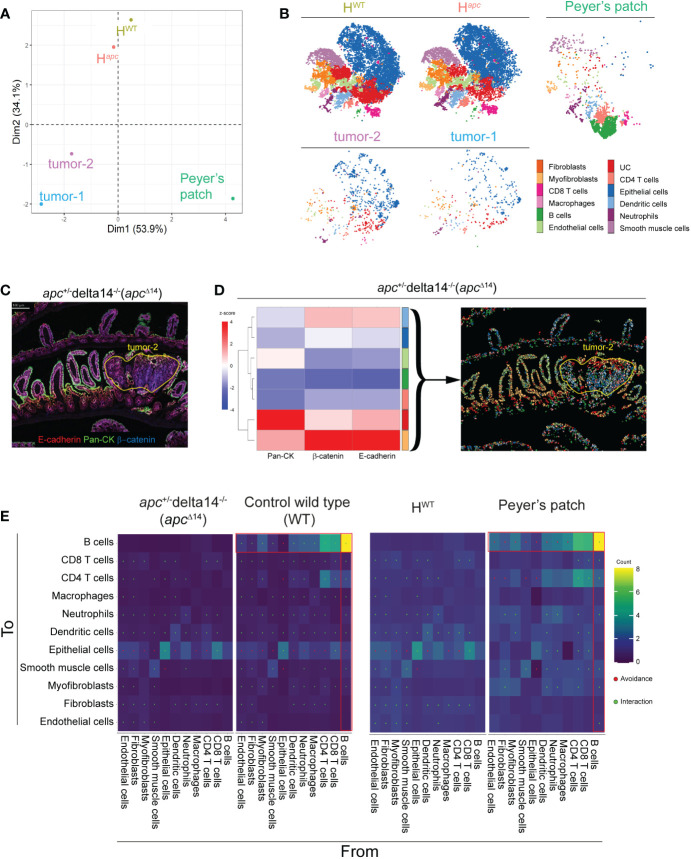
Figure 4.
Comparison of cell heterogeneity and interactions in healthy and tumor intestine samples. (A) Principal component analysis of the five zones of interests based on the abundance of the clusters identified in ( Figure 3B ). HWT: whole WT tissue sample minus the Peyer’s patch; H Apc : whole Apc Δ14+ tissue sample minus the two tumor nodes identified by a pathologist. (B) Visualization of high-dimensional images using t-SNE and based on marker expression. Each color corresponds to one of the clusters identified in ( Figure 3B ). (C) Pseudo-colored image showing the signal intensity for E-cadherin, β-catenin and pan-cytokeratin in the Apc Δ14+ intestine tissue sample. (D) Heatmap showing the z-score of the marker expression in the sub-clusters generated by Phenograph based on E-cadherin, β-catenin and pan-cytokeratin expression from the epithelial cluster identified in ( Figure 3B ) and localized in the Apc Δ14+ intestine tissue section. Each color identifies an individual cluster. (E) Heatmap in which dots indicate significant interaction or avoidance between the indicated clusters. Red squares indicate interactions (green) or avoidance (red) of B cells with the other clusters.

