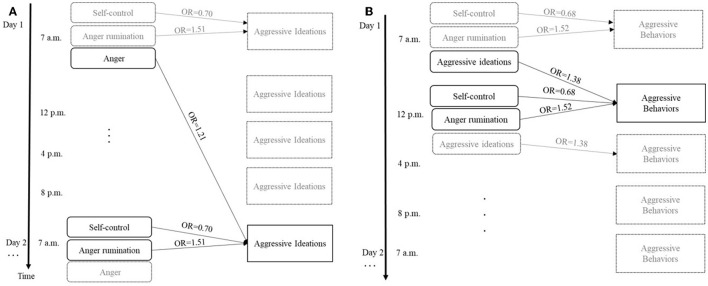
Figure 2.
(A) Results of the analyses for aggressive ideations (B) Results of the analyses for aggressive behaviors. The Figure avoids overlapping arrows, though same pattern applies to every momentary assessment (e.g., aggressive behaviors at 12 p. m. are also associated with the predictors at 12 p. m., etc.). For illustration purpose, only significant results were marked with arrows. OR, Odd Ratio.

