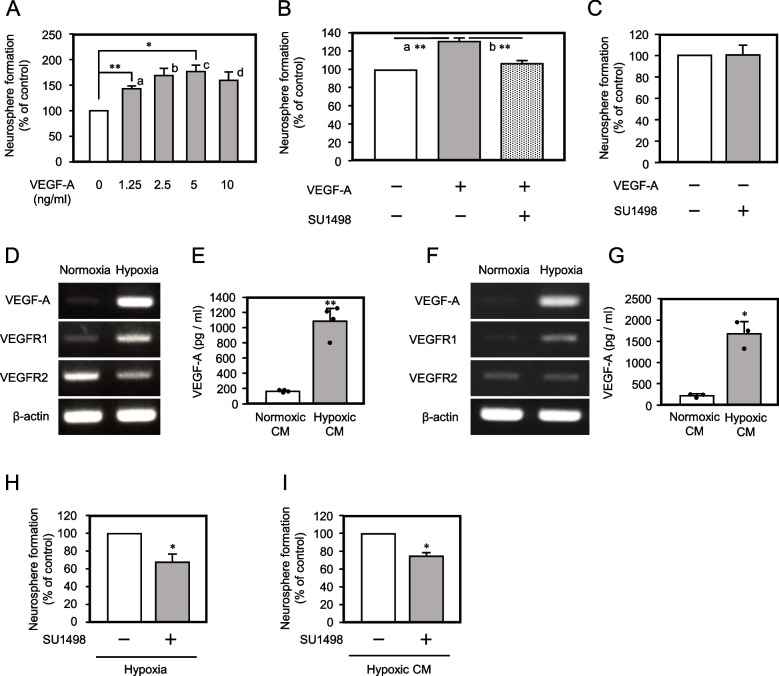
Fig. 3.
VEGF-A is secreted from NSPCs and enhances neurosphere formation under hypoxic condition. A Quantification of neurospheres from NSPCs by administration of VEGF-A (mean ± SEM, n = 3, ** p = 0.00754, * p = 0.0436, (a p = 0.00377, b p = 0.0305, c p = 0.0218, d p = 0.0473 to the control in the case of one-sided test)). B Quantification of neurospheres from NSPCs by administration of 10 ng/ml of VEGF-A and 700 nM of VEGFR2 inhibitor, SU1498 (mean ± SEM, n = 3, a p = 0.00555, b p = 0.00695). The equivalent volume of DMSO which was used as solvent of SU1498 was administrated in the control. C Neurosphere formation from enriched E14.5 NSPCs in the presence of SU1498 (700 nM) under the normoxic condition. D VEGF-A gene expression in NSPCs isolated from E11.5 brain under the hypoxic condition was analyzed by semi-quantitative reverse transcription-PCR. The gel images were cropped and the full-length gel images were shown in Fig. S12A. E Measurement of VEGF-A in the E11.5 NSPC culture under the normoxic or the hypoxic condition by ELISA (mean ± SEM, n = 4, ** p = 0.002858). Each black dot indicates the VEGF-A values in each sample. F VEGF-A gene expression in NSPCs isolated from E14.5 brain under the hypoxic condition was analyzed by semi-quantitative reverse transcription-PCR. The gel images were cropped and the full-length gel images were shown in Fig. S12B, C. The gel image of VEGF-A was inverted horizontally. G Measurement of VEGF-A in the E14.5 NSPC culture under the normoxic or the hypoxic conditions by ELISA (mean ± SEM, n = 3, * p = 0.01448). H Quantification of neurospheres of NSPCs formed in the hypoxic neurosphere formation culture supplemented with or without SU1498 (mean ± SEM, n = 4, * p = 0.0482). I Quantification of neurospheres of NSPCs formed in the conventional normoxic neurosphere formation culture with the hypoxic NSPC CM, supplemented with or without SU1498 (mean ± SEM, n = 4, * p = 0.0107)

