
Figure 1.
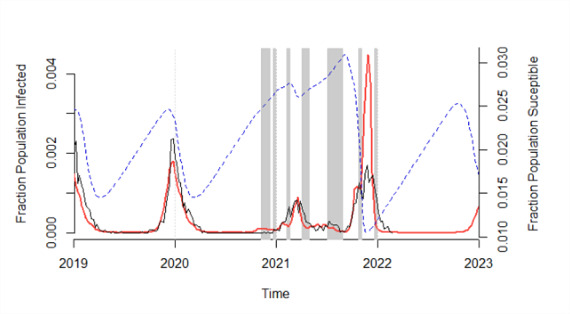
Respiratory syncytial virus (RSV) simulation (red lines) produced on week 37/2021 (before the 20/21 RSV epidemic) compared with the observed RSV laboratory-confirmed cases (dark lines) from week 1/2019 to week 6/2022 (including the 20/21 RSV epidemic). RSV simulation was generated, using the time-series susceptible-infected-recovered (TSIR) model fitted to the 2021 demographic data of Lyon and including the different non-pharmaceutical interventions (NPI) control periods (gray bar). The estimated weekly population proportion susceptible is shown aside (blue dashed lines).