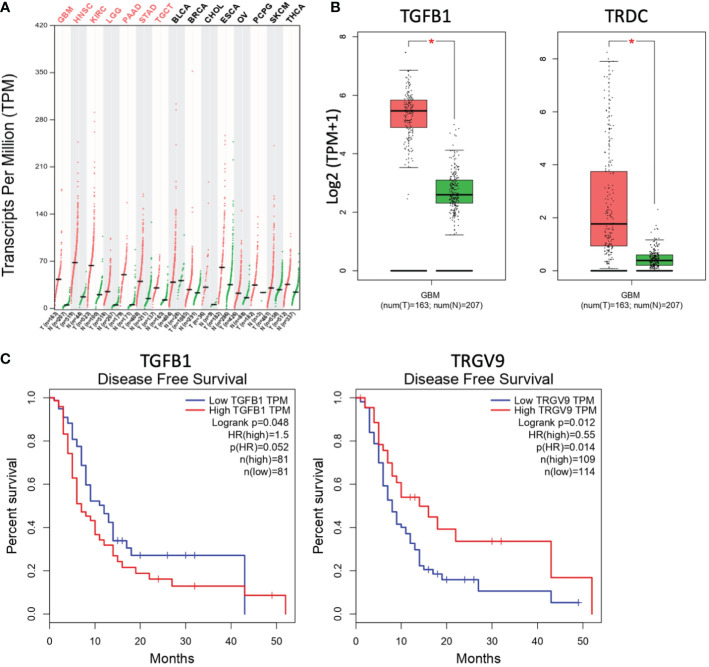
Figure 1.
Levels of TGF-β and γδ TCR transcripts are differently linked to the prognosis of glioblastoma tumors. (A) The abundance of human TGF-β transcripts (TPM, transcripts per million) across various indicated cancers (T, red) and the normal tissues associated (N, green) was analyzed and compared by matching TCGA and GTEx data. GBM, glioblastoma multiforme; HNSC, head and neck squamous cell carcinoma; KIRC, kidney renal clear cell carcinoma; LGG, brain lower grade glioma; PAAD, pancreatic adenocarcinoma; STAD, stomach adenocarcinoma; TGCT, testicular germ cell tumors; BLCA, bladder urothelial carcinoma; BRCA, breast invasive carcinoma; CHOL, cholangiocarcinoma; ESCA, esophageal carcinoma; OV, ovarian serous cystadenocarcinoma; PCPG, pheochromocytoma and paraganglioma; SKCM, skin cutaneous melanoma; THCA, thyroid carcinoma. Red abbreviations, tumors with significantly increased TGF-β transcripts, as compared to normal tissues. n, number of clinical samples. (B) Comparative analyses of transcript levels [Log2 (TPM+1)] of TGF-β1 (TGFB1, left) and TCR δ chain (TRDC, right) in GBM tumors (red) vs normal tissues associated (green). *p<0.05. (C) Compared disease-free survival curves for GBM patients with high (red) vs low (blue) levels of transcripts of TGF-β1 (left; TGFB1; cutoff-high 50%) or TCR Vγ9 chain (right; TRGV9; cutoff-high 25%). Data from GEPIA (http://gepia.cancer-pku.cn/).

