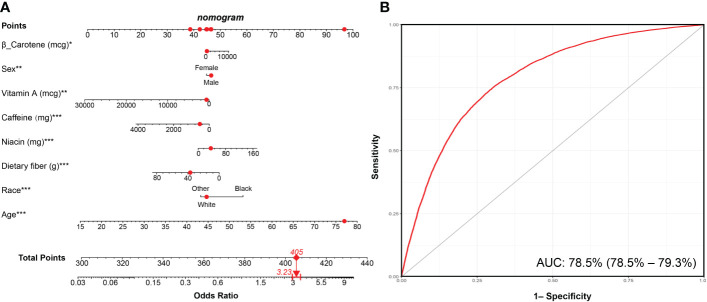
Figure 5.
Nomogram model established for predicting the risk of hypertension and its ROC curve. (A) Nomogram model based on the key dietary factors screened by LASSO regression, and the red points show an example. For 77-year-old male participants with hypertension, the probability of hypertension increased by 3.23-fold. (B) ROC curve for evaluating the diagnostic power of the nomogram model in this study. *** p < 0.001, ** p < 0.01, * p < 0.05.

