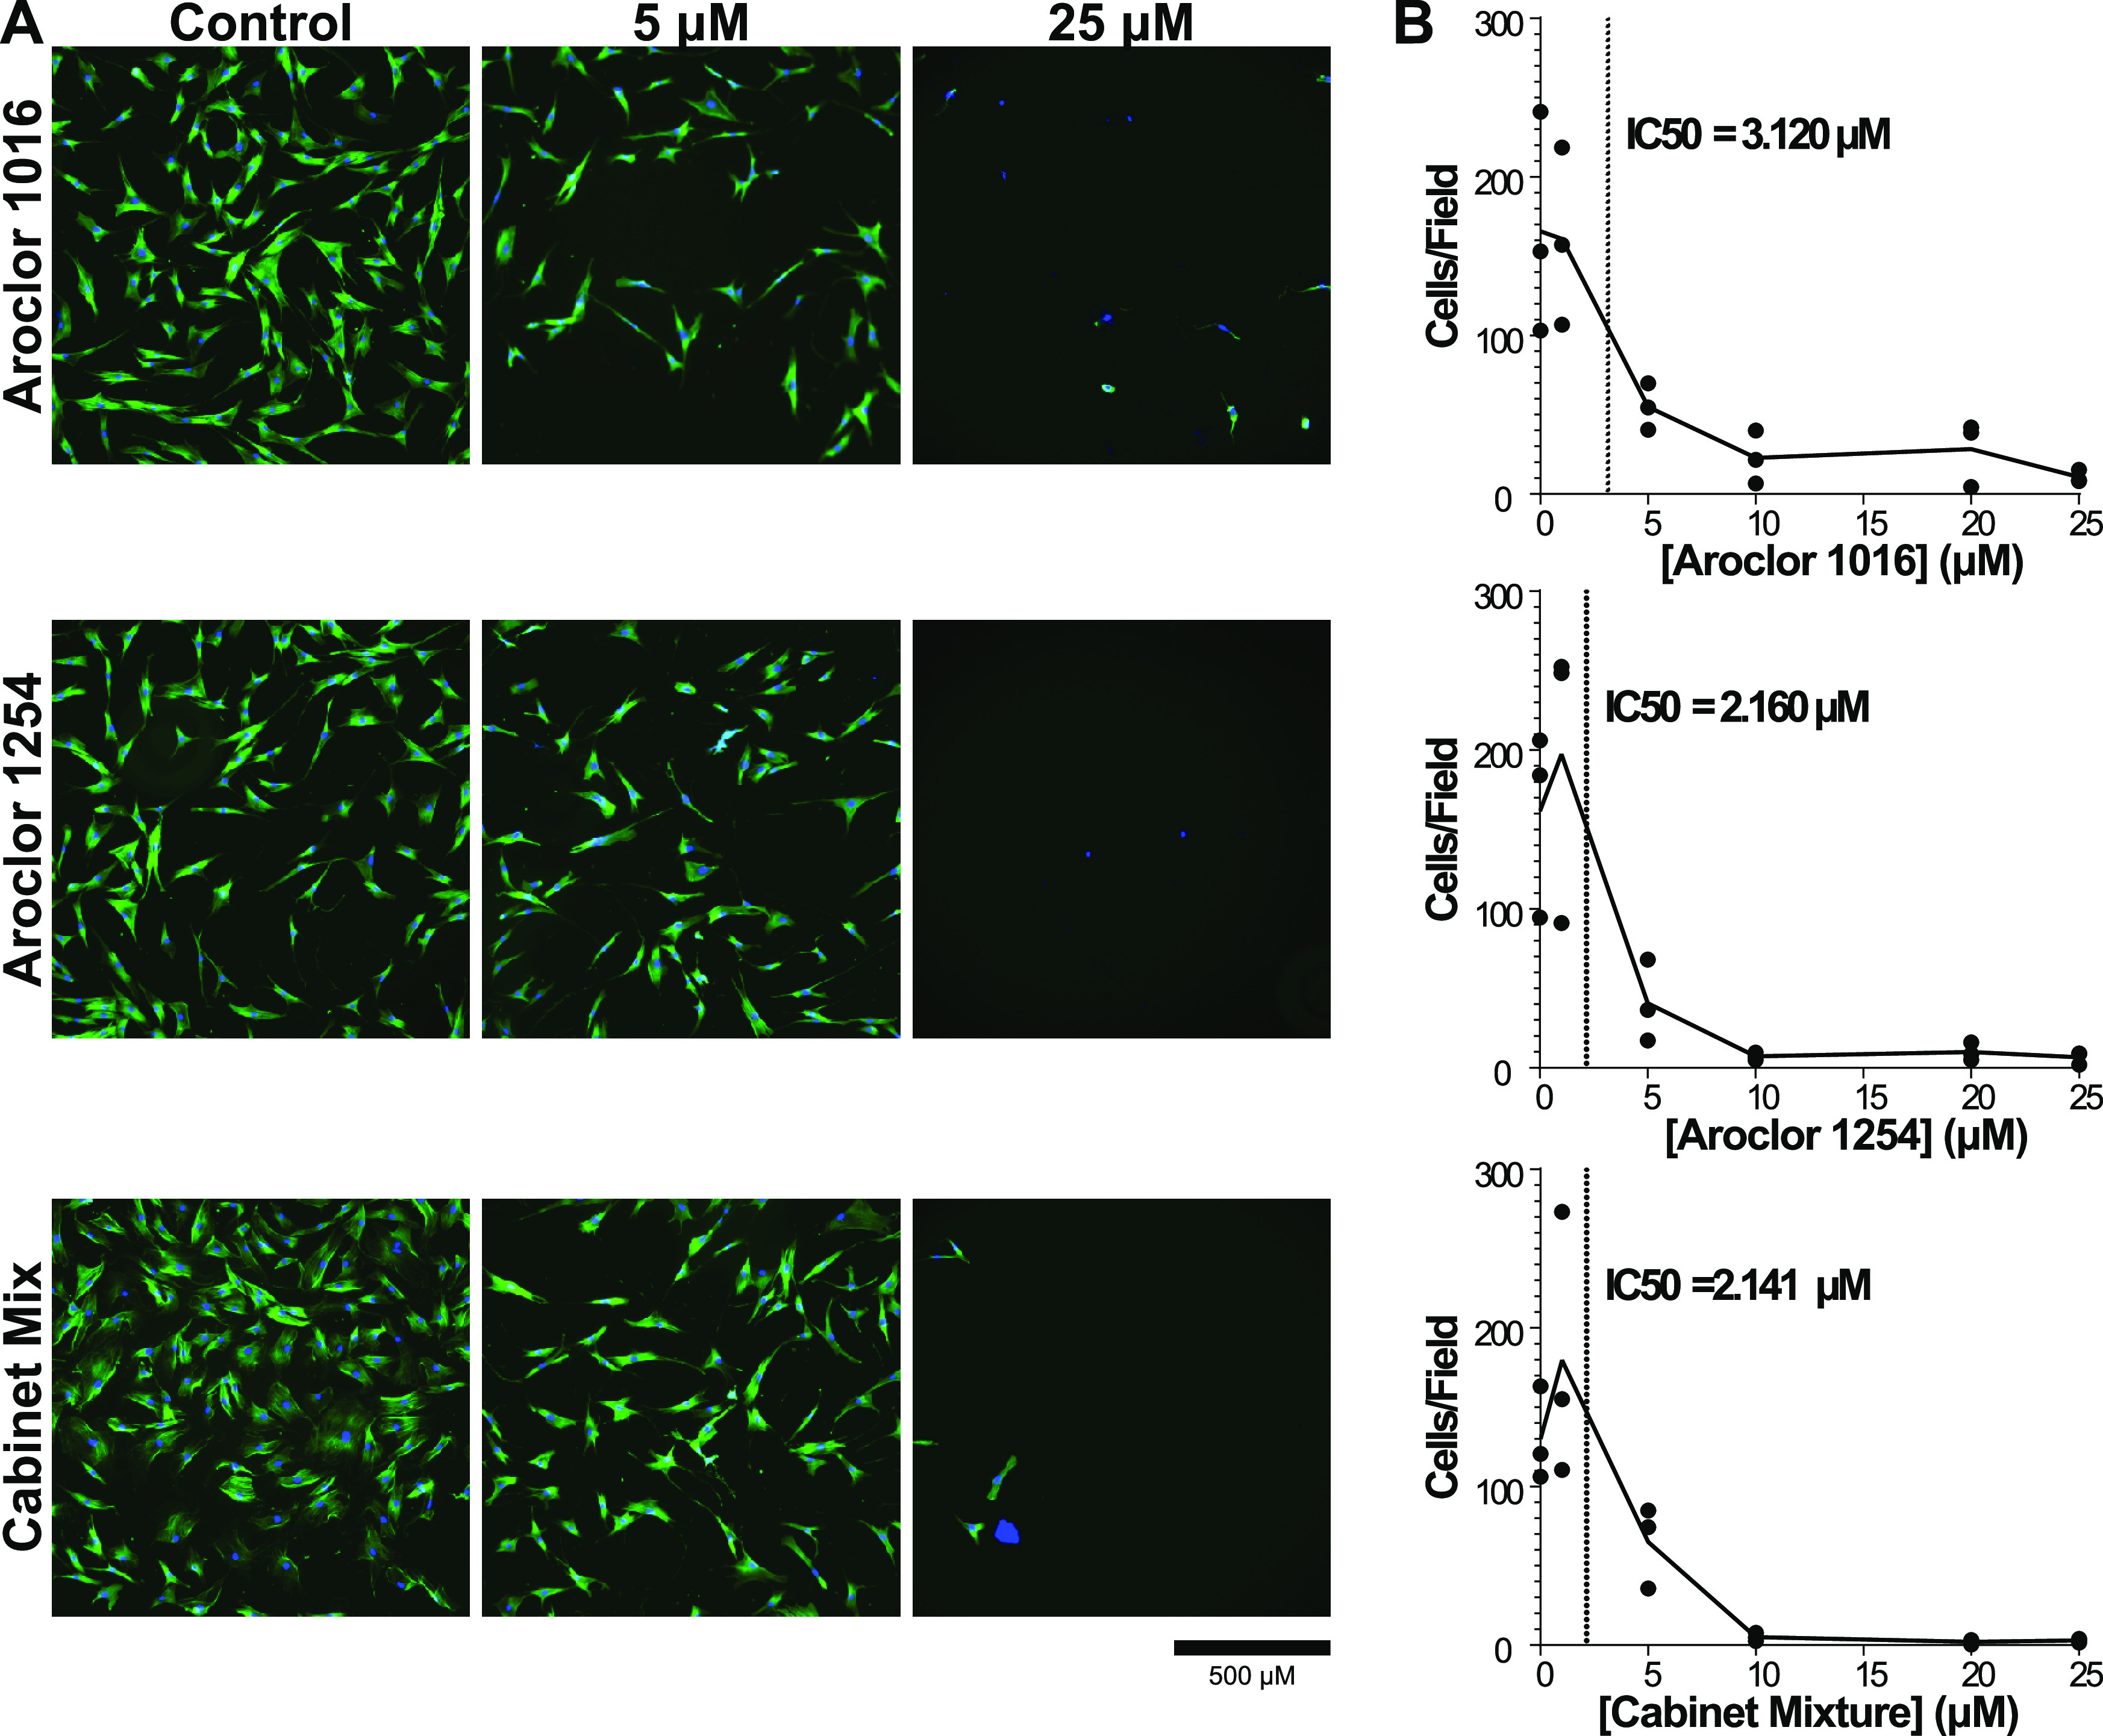
Figure 2.

Cell count decreases with increasing exposure to PCB mixtures. (A) Representative images of adipose MSCs exposed to 0, 5, or 25 μM concentrations of Aroclor 1016, Aroclor 1254, and Cabinet Mixture. (B) Number of cells was determined by using ImageJ software to count the number of nuclei per image field. Quantification was performed on 25 images per condition for three independent adipose MSC donors. Data are represented via a point for the mean of each donor (n = 25 image fields/point) with a line connecting the mean value of all donors (n = 3 donors). IC50 values calculated using Prism for Aroclor 1016, Aroclor 1254, and Cabinet Mixture are 3.120, 2.160, and 2.141 μM, respectively.
