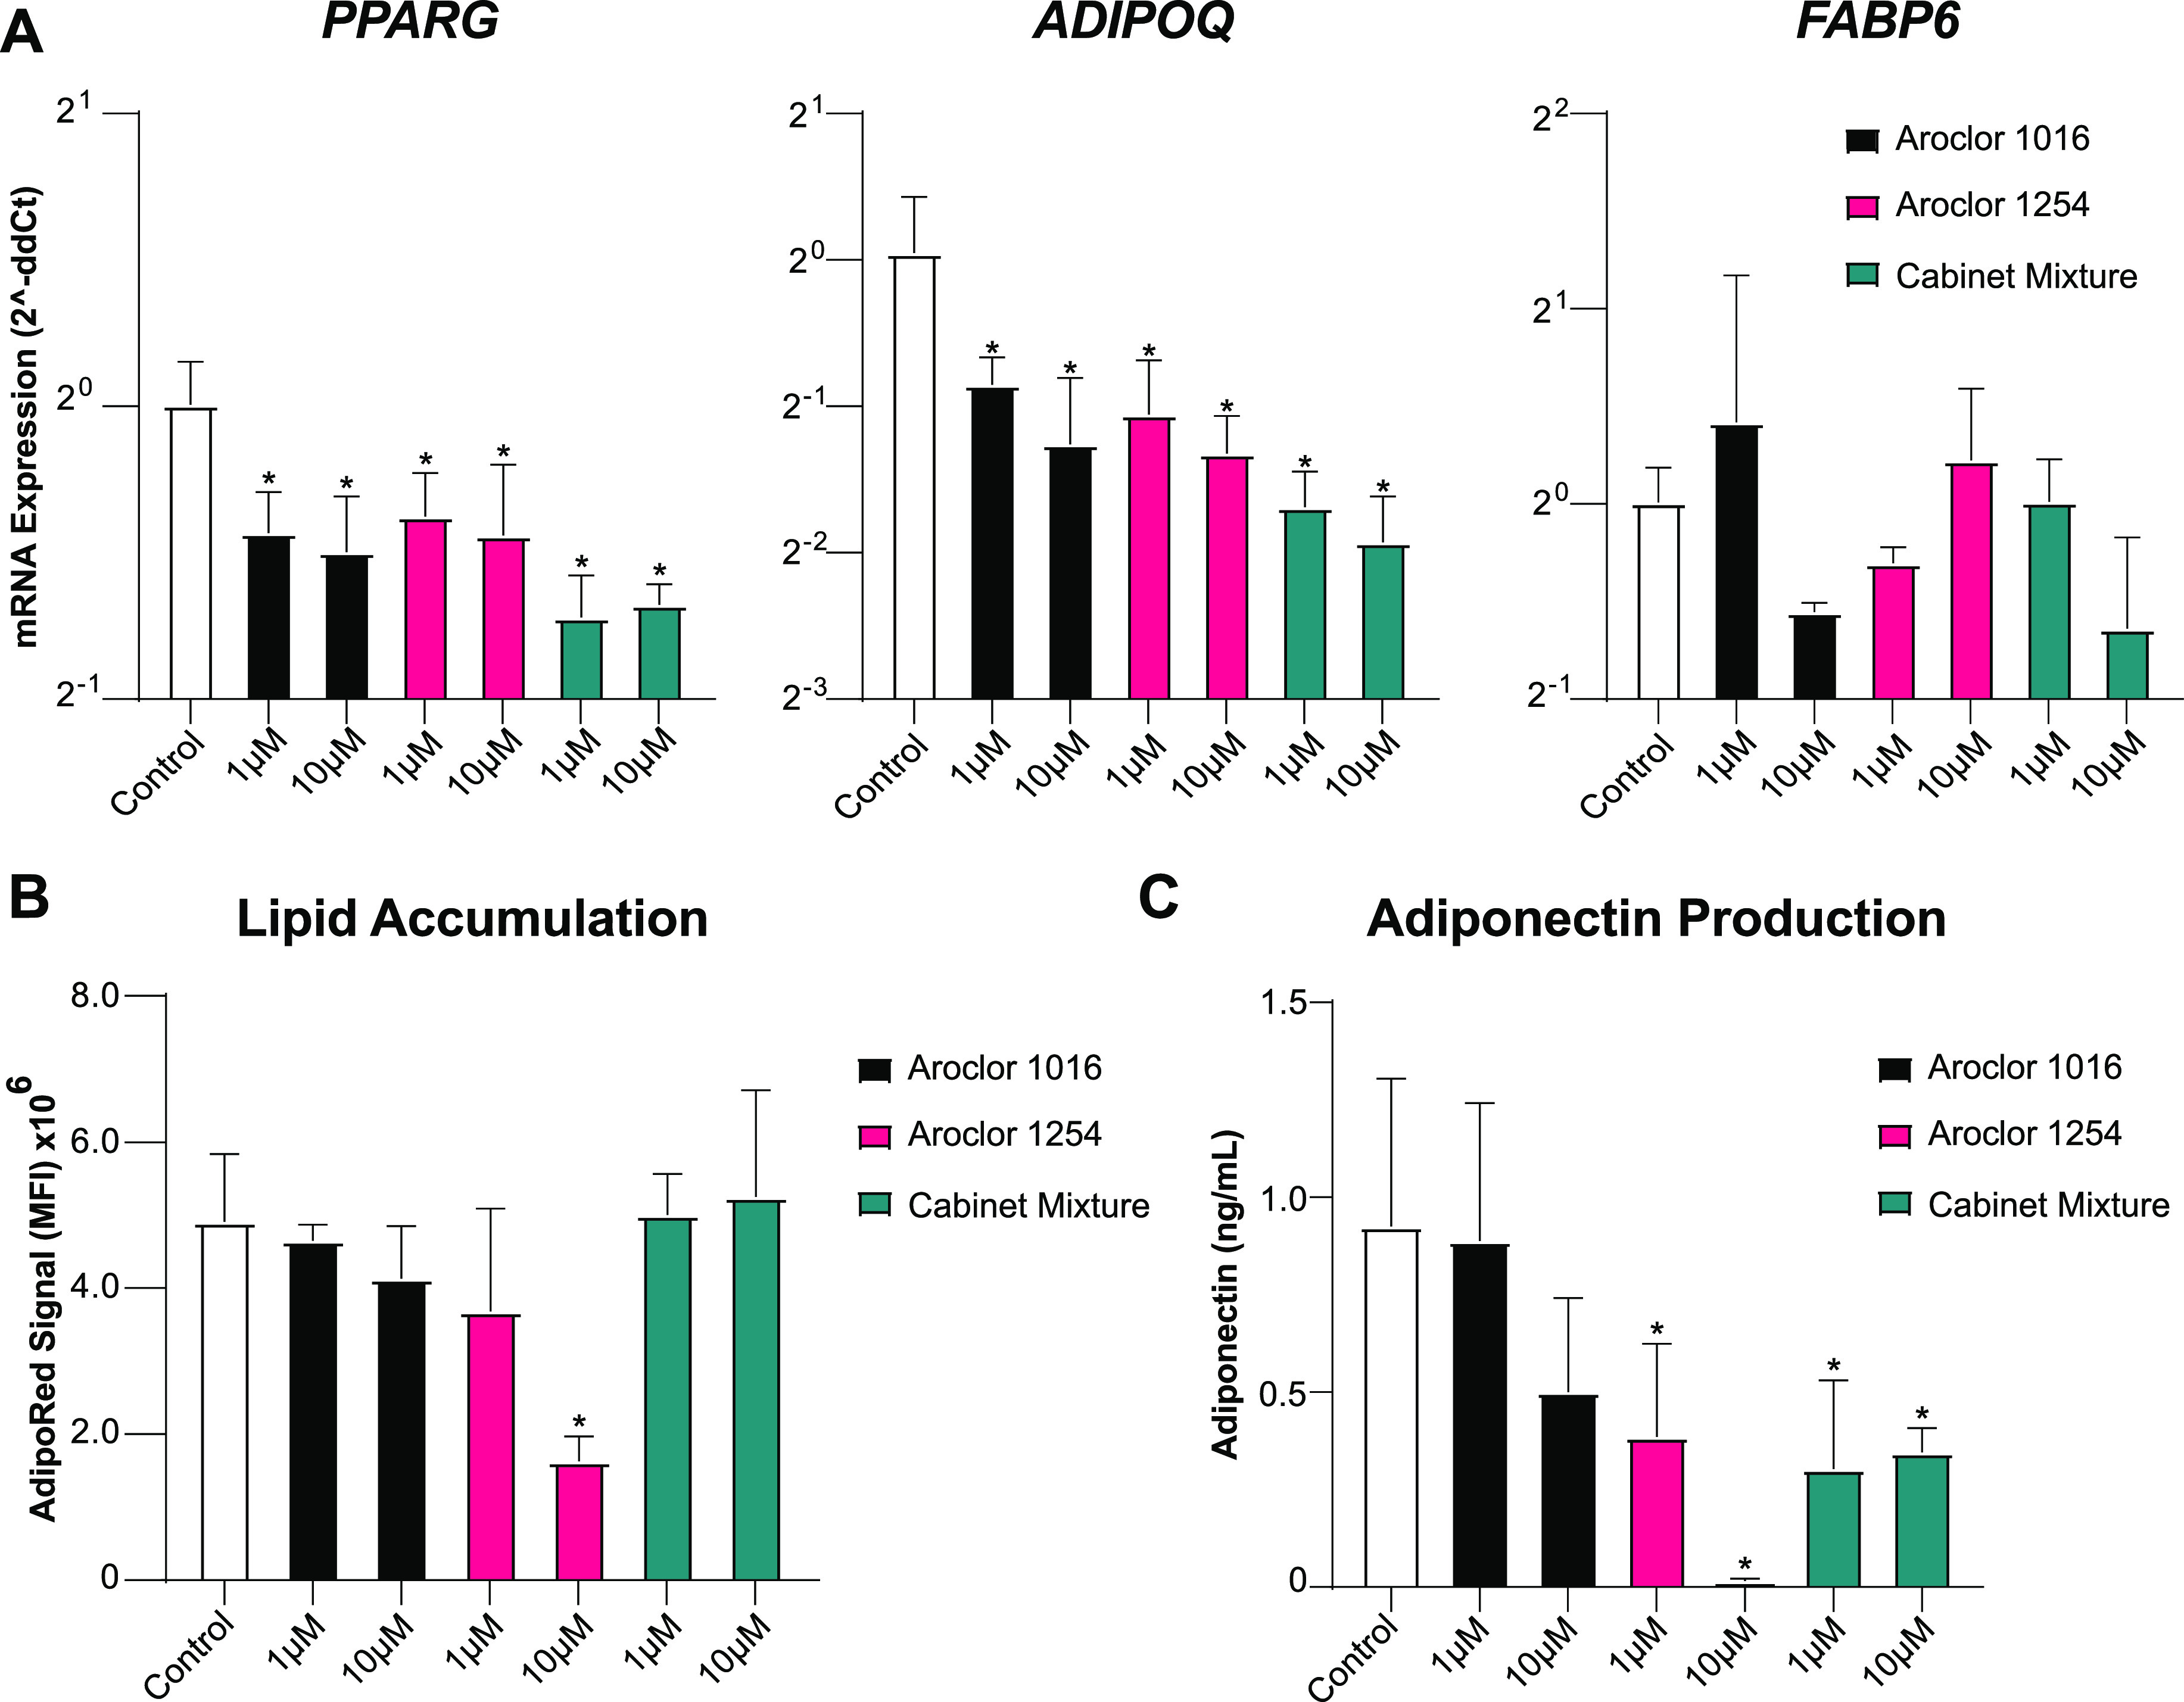
Figure 5.

Adipogenic differentiation of MSCs is slightly diminished after pre-exposure to PCB mixtures. (A) Fold change of the expression of prominent genes in the adipogenesis signaling pathway, PPARG, ADIPOQ, and FABP6. Delta-CT was calculated using GAPDH and then compared to vehicle-treated controls using the Delta–Delta-CT method. n = 3 experiments with Adipose MSC donor 2334. (B) Lipid accumulation as measured by AdipoRed staining measured using a 96-well plate reader. (C) Adiponectin present in culture media measured using ELISA. Bars are mean +/– SD of n = 4 experiments with adipose MSC donor 2334. Ordinary one-way ANOVA with Dunnett post-hoc test, * indicates p < 0.05 compared vehicle controls.
