
Figure 2. Mouse Cerebrospinal Fluid (CSF) Protein Abundance in Aging.
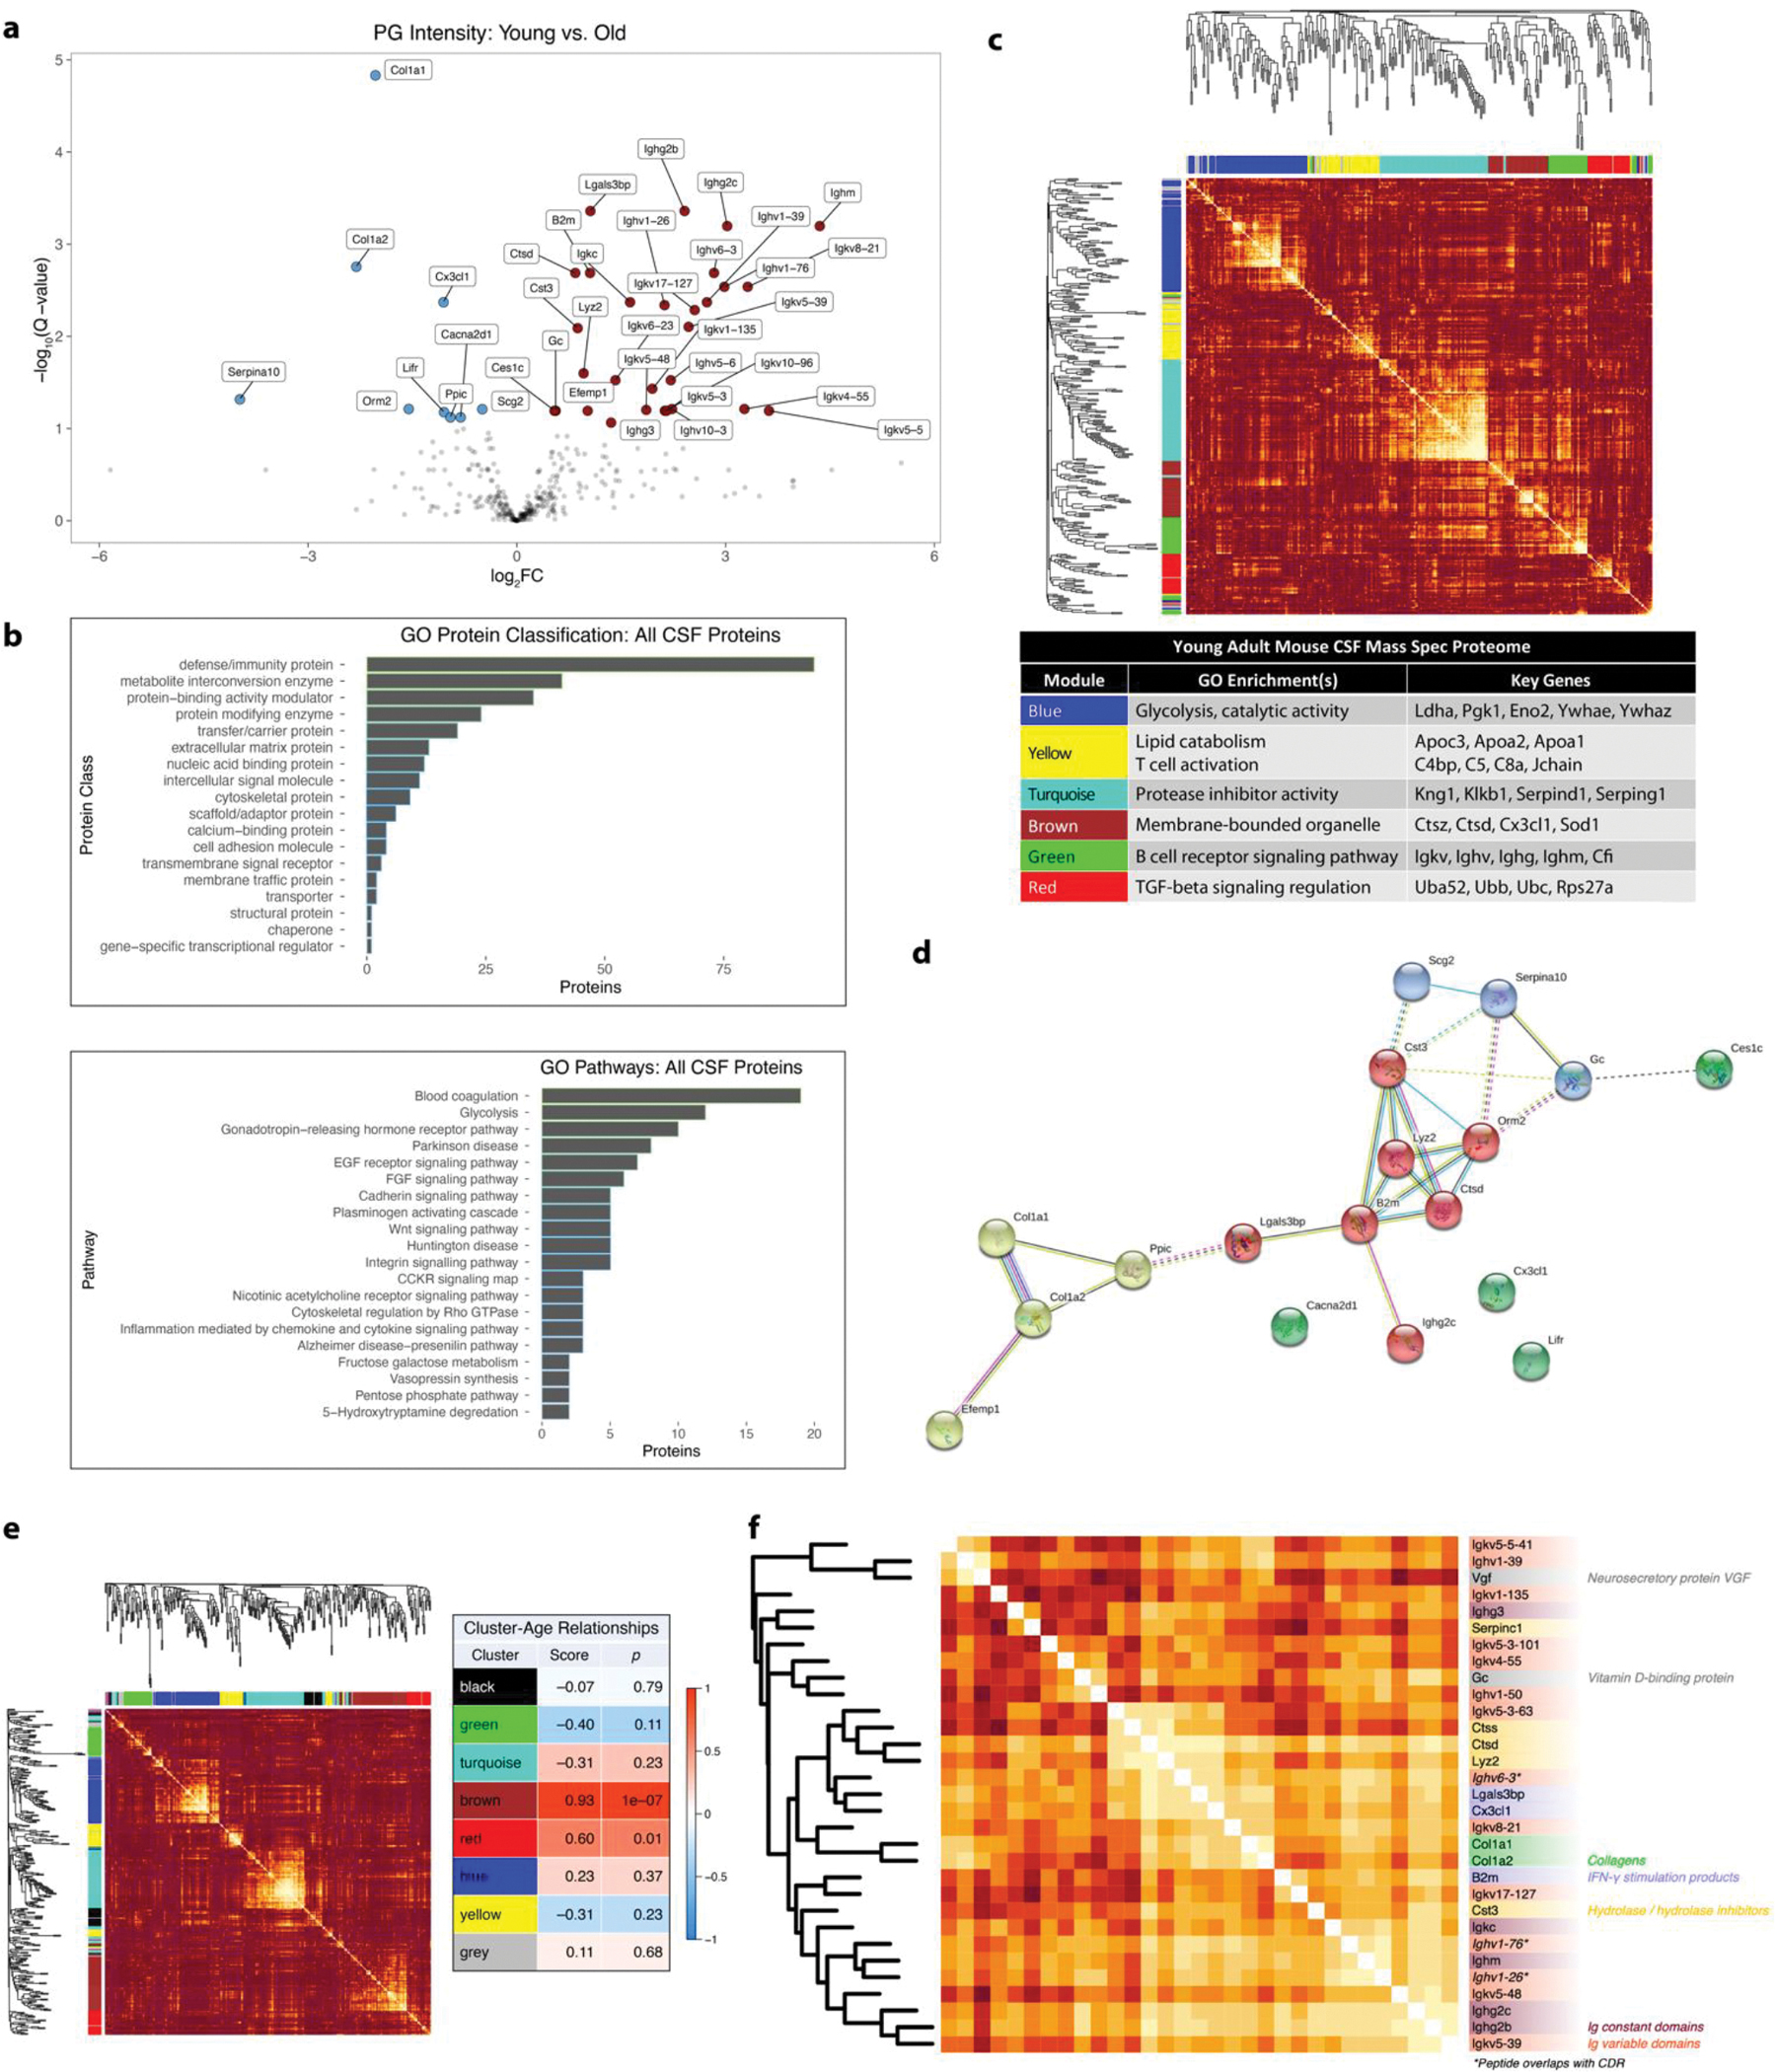
a. Volcano plot of 357 Spectronaut IDPicker PG intensities compared between young vs. old mouse CSF. Cutoff: FDR = 0.1.
b. GO annotation for all mouse CSF proteins sequenced in this study.
c. Weighted gene co-expression network analysis (WGCNA) of young adult mouse CSF (338 IDPicker PGs).
d. STRING-DB network analysis of hits. Cluster coloring by STRING algorithm. Dotted lines represent links between clusters.
e. WGCNA of 342 PG abundances from young and old mouse CSF, with the strength of relationship between each module and mouse age. Relationship score is Pearson coefficient of correlation between module eigengene and mouse age.
f. Annotated heatmap of a sub-module of the brown module in Extended Data Figure 1E. Asterisks denote germline chains with partially or wholly sequenced complementarity-determining regions (CDRs). All heatmap colors range from |Pearson correlation coefficient| = 0 (dark orange) to |Pearson correlation coefficient| = 1 (white).