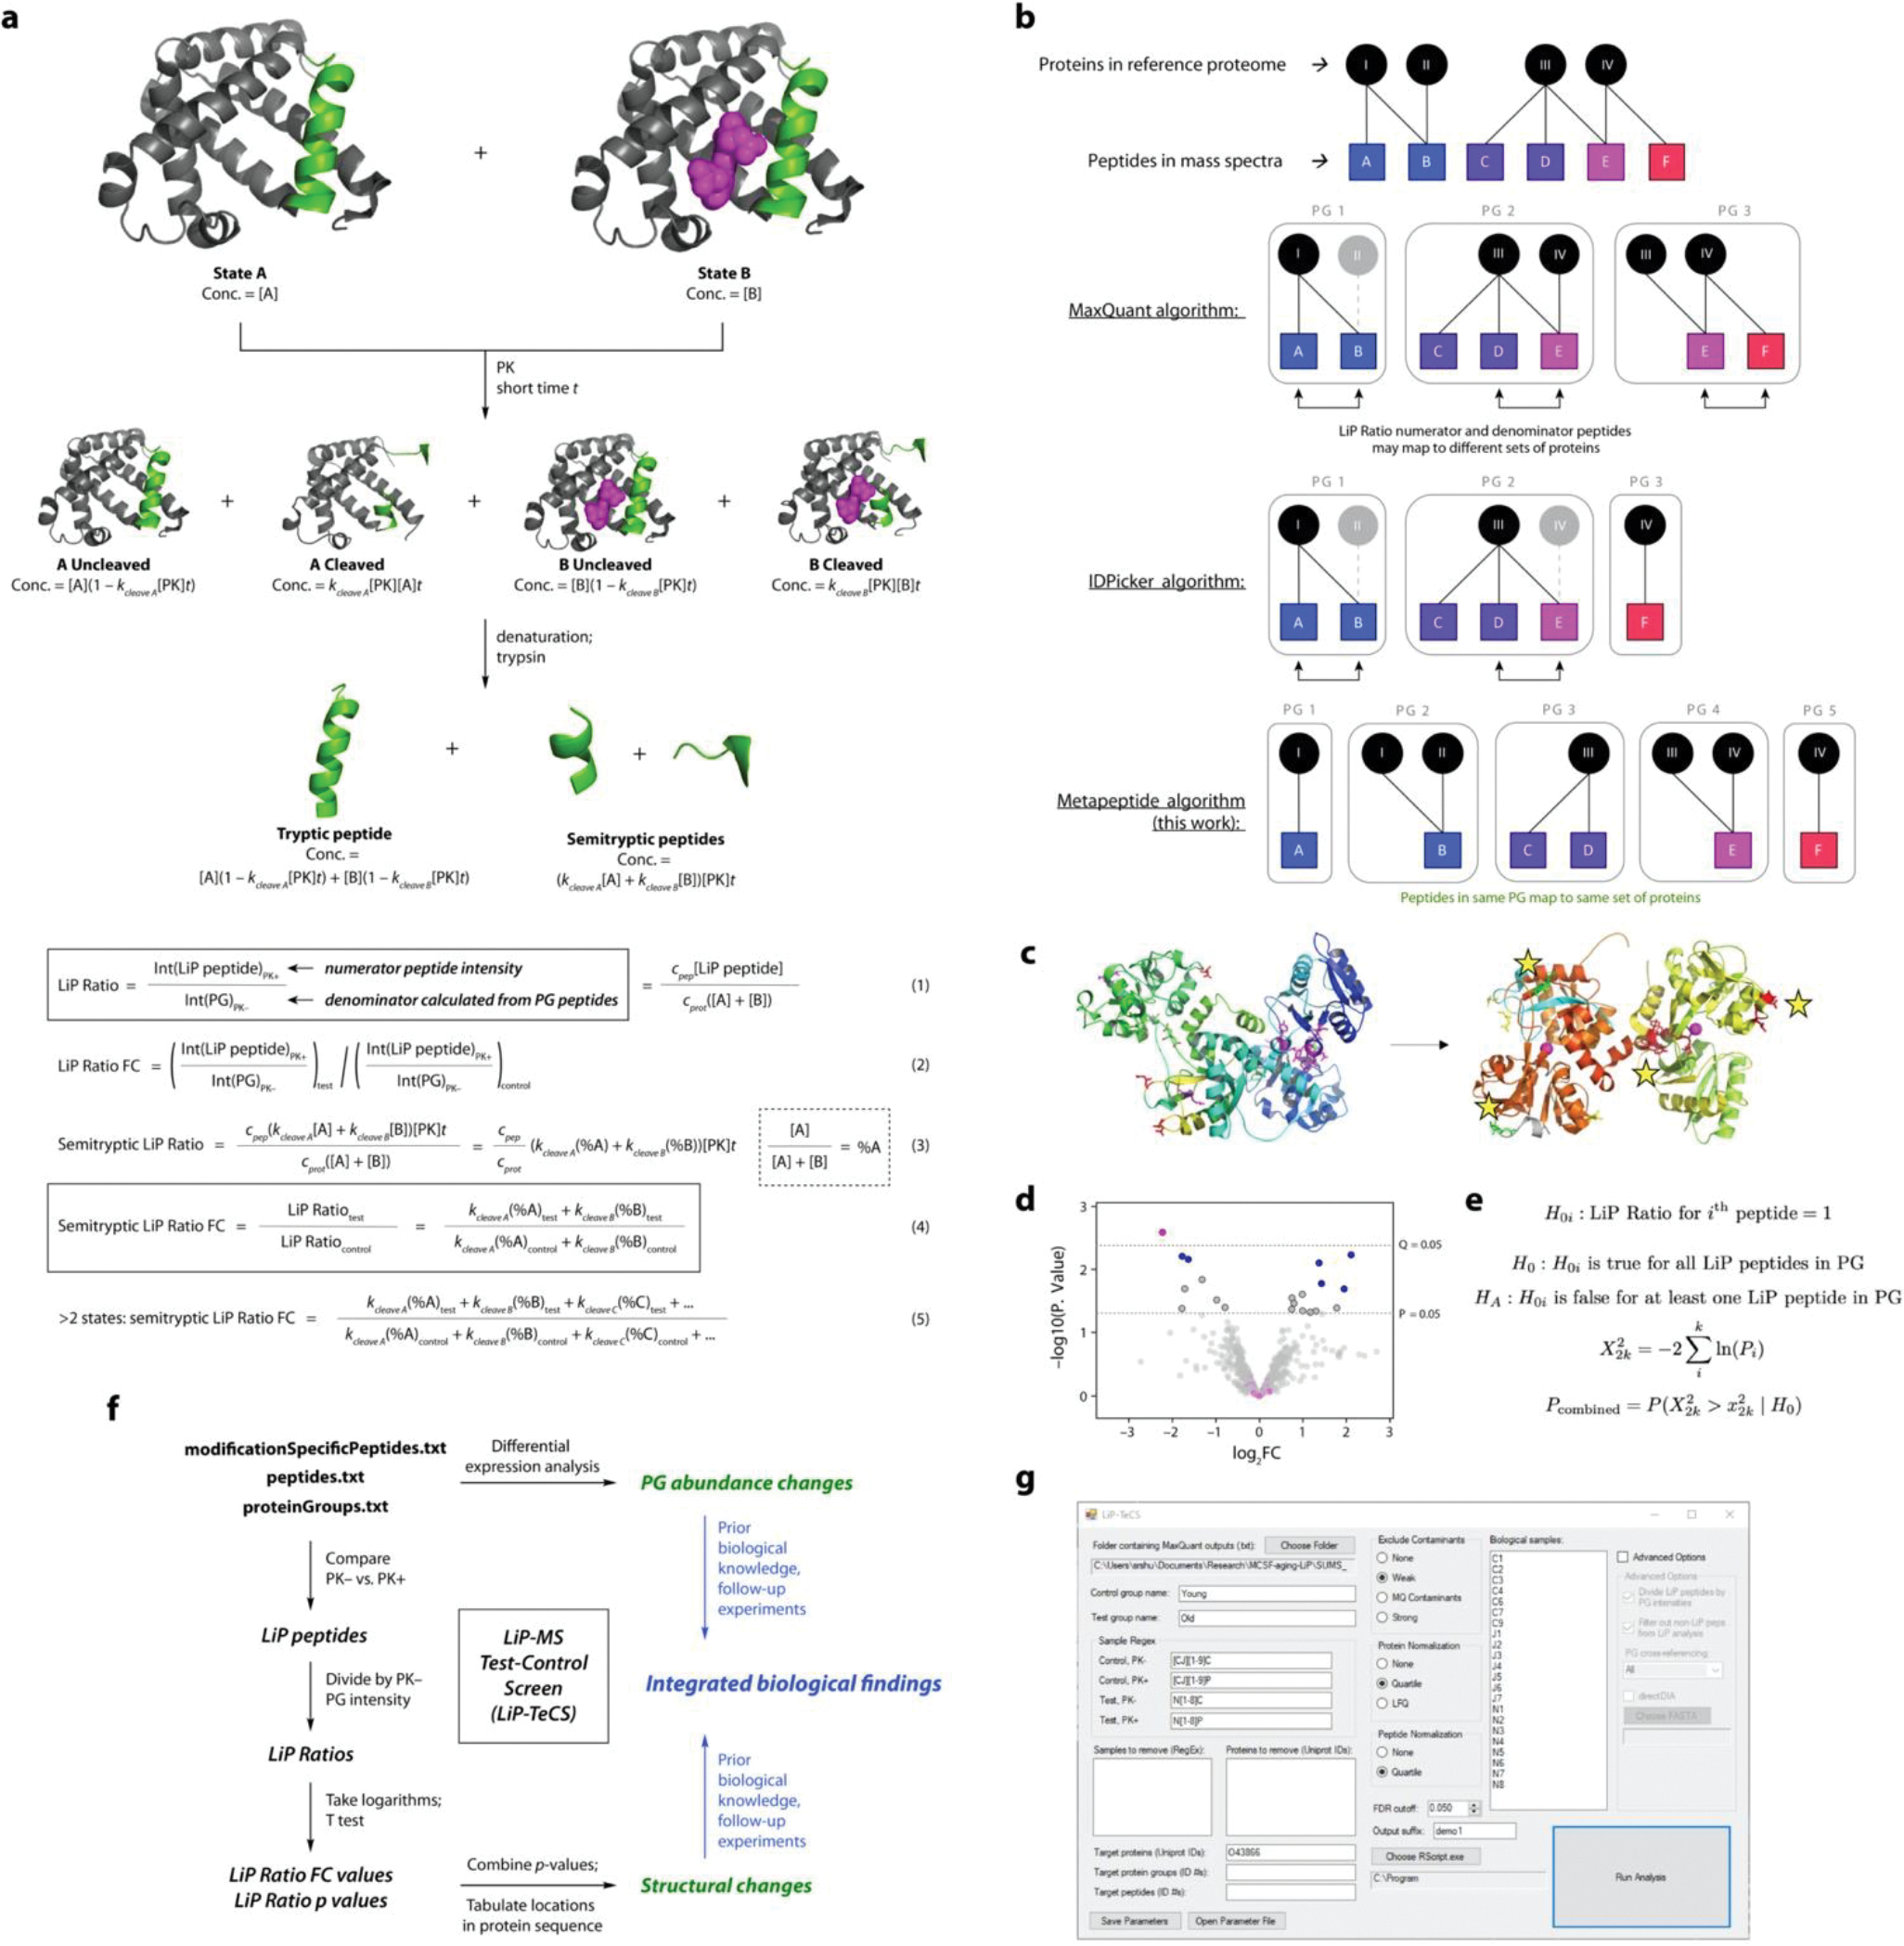
Extended Data Figure 1. Theoretical and Computational Development of the LiP-MS Test-Control Screen (LiP-TeCS) Platform.

a. Derivation of an expression for the LiP Ratio fold change (FC) in terms of concentrations and rate constants. Assumptions and details of the model are discussed in the Supplementary Information. For tryptic peptides, coefficients kcleave X are replaced by coefficients f(kcleave X) = (1 − kcleave X[PK]t) in Equations 4 and 5.
b. Illustrations of protein grouping algorithms. In the indicated softwares, gray objects are omitted from the outputs to reduce redundancy and protein ID overestimation. The metapeptide method ensures that the LiP Ratio numerator peptide and all peptides in the denominator PG map to the same set of proteins and that all information is (matches are) reported.
c. In transferrin (Tf), a single structural change (Fe binding) results in significant LiP Ratio FCs at multiple sites on the same protein, shown here with yellow stars. Structural change occurs at the protein level.
d. Example peptide-level LiP-MS analysis. p-value from two-sided T test, q-value from Benjamini-Hochberg correction. A PG containing multiple significant peptides by p value but not q value (blue) would not be considered in the same dataset as a PG with one significant q value and numerous non-significant peptides (pink).
e. Formulation of the Fisher method in this experiment. Assumptions are discussed in the Supplementary Information.
f. Flow chart showing the implementation of these concepts, as well as the analysis described in Ref. 20, in a single workflow called LiP Test-Control Screen (LiP-TeCS) (black and green objects). Blue objects represent downstream interpretation.
g. Screenshot of the LiP-TeCS desktop app.
