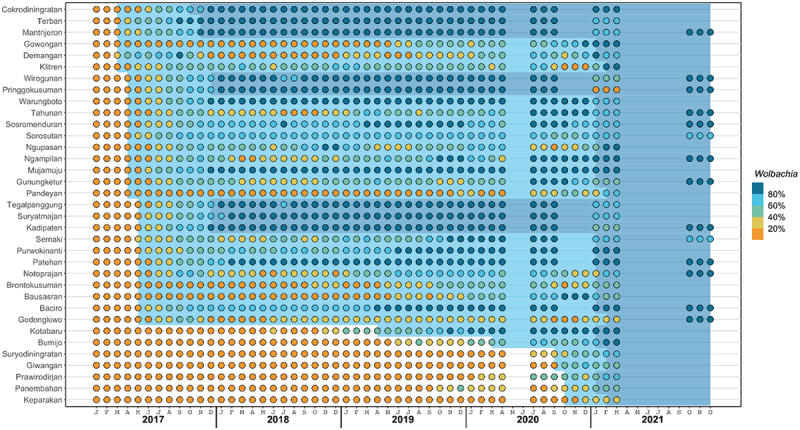
Figure 4.

Wmel introgression by kelurahan, 2017 – 2021. Circles indicate the 3-month moving average wmel infection prevalence in local Aedes aegypti mosquito populations categorised into quintiles, in each of 35 kelurahans (vertical axis) between January 2017 and December 2021 (horizontal axis). Light blue and dark blue background shading indicate the period during which each kelurahan is considered ‘partially treated’ and ‘fully treated’, respectively (see Methods for definitions).
