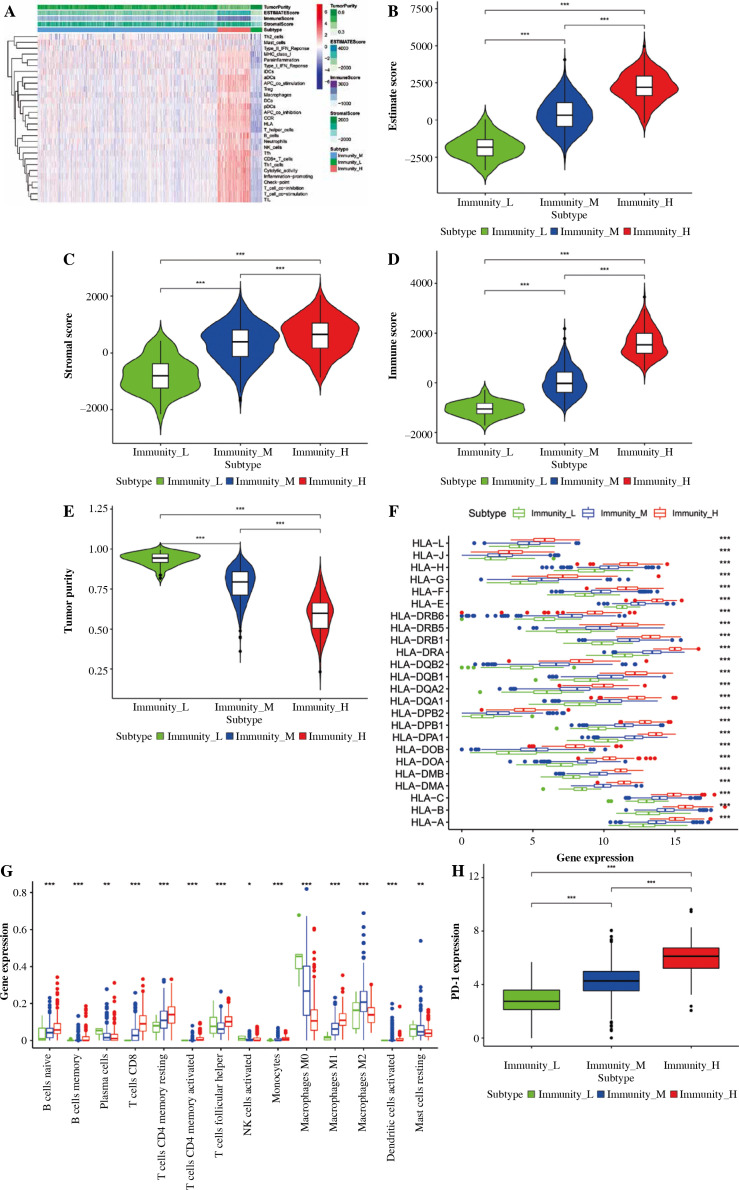
Fig. 1.
Construction and validation of breast cancer (BC) immune infiltration clustering. A) Enrichment levels of 29 immune-related cells and types in the high immune infiltration group, middle immune infiltration group, and low immune infiltration group. The ESTIMATE Score, Stromal Score, Immune Score, and Tumor Purity of every patient gene are shown combined with the clustering information. B-E) The violin plot shows the difference in ESTIMATE Score, Stromal Score, Immune Score, and Tumor Purity between three clusters. F) The expression of most HLAs showed a significant difference in the high, middle, and low immune infiltration clusters. *p < 0.05, **p < 0.01, ***p < 0.001 G) The boxplot shows the percentage of immune cells among the high, middle, and low immune infiltration clusters using the CIBERSORT algorithm. H) The expression of most HLAs showed a significant difference in high, middle, and low immune infiltration clusters. *p < 0.05, **p < 0.01, ***p < 0.001

