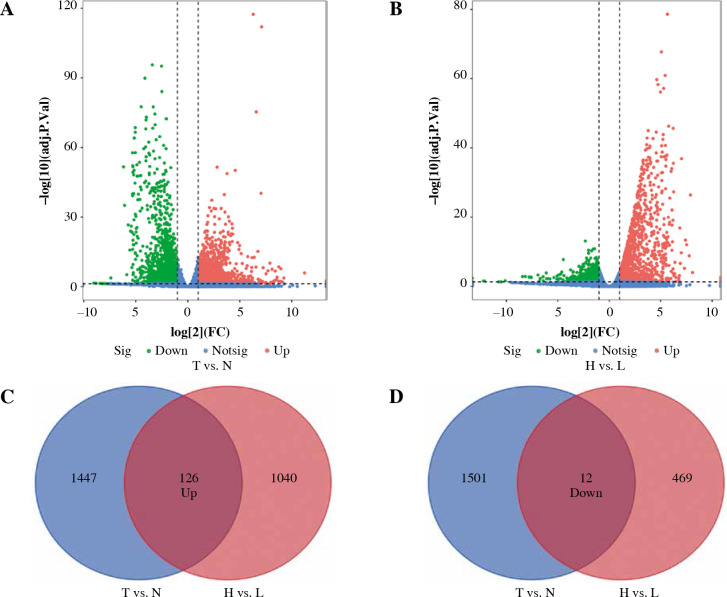
Fig. 2.
Identification of differentially expressed genes. A) The volcano plot shows 1573 up-regulated genes and 1513 down-regulated genes between breast cancer (BC) and normal breast tissues (T vs. N). B) The volcano plot shows 1166 up-regulated genes and 581 down-regulated genes between high immune infiltration cluster and low immune infiltration cluster (H vs. L). C, D) Venn diagram of the intersection of DEGs between T vs. N and H vs. L

