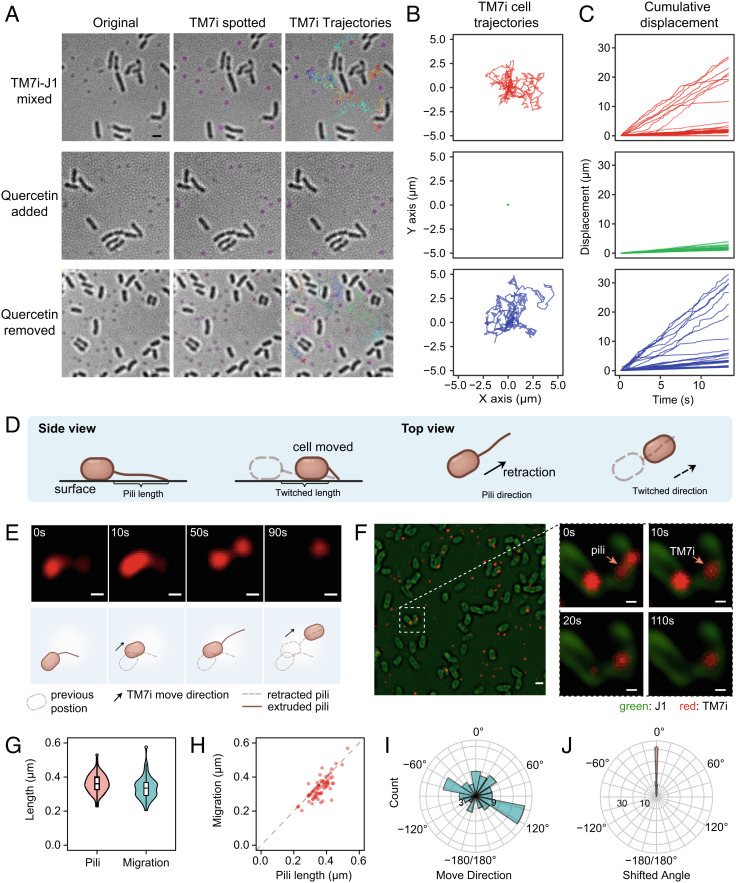
Fig. 3.
Genomically conserved T4P enabled motility of TM7i cells. (A) Inhibition of TM7i motility in vivo using T4P inhibitor quercetin. TM7i exhibited high motility in symbiosis with J1 (Top row); quercetin (200 μM) reduced TM7i motility (Middle row); the motility of TM7i cells was recovered after quercetin removal (Bottom row). Original bright field images (Left), TM7i cells spotted overlay (Middle), and TM7i trajectories overlay (Right) within a 30-s time-lapse recording are shown. Identified TM7i cells are marked with purple circles in the Middle panel. Trajectories of motile TM7i cells are marked with different colors. (B) Trajectory plot of individual cells corresponding to Panel (A). For each group, 30 trajectories were acquired randomly and plotted from three independent experiments. (C) Cumulative displacement against time for the three groups. (D) Schematic of T4P-mediated movement of bacterial cells. (E) Structured illumination microscopy (SIM) imaging of pili-mediated motility of TM7i labeled with NHS ester of Alexa Fluor 555. The schematics depict the interpretive cell layout. (Scale bar, 200 nm.) (F) SIM images show that TM7i infects J1 by pili adhesion (also see Movie S2). J1 and TM7i cells were separately labeled and freshly mixed for live SIM imaging. J1 cells were labeled with NHS ester of Alexa Fluor 488. Images are indicative of three independent experiments. (Scale bar in left, 500 nm; scale bars for zoom-in views, 200 nm.) (G) Box plot of the extruded T4P length and the consequent cell migration. (H) The consistency between the extruded T4P length and the resultant cell migration. (I) The directions of TM7i movements (n = 73). (J) The shifting angle between T4P extrusion and the resultant movement.

