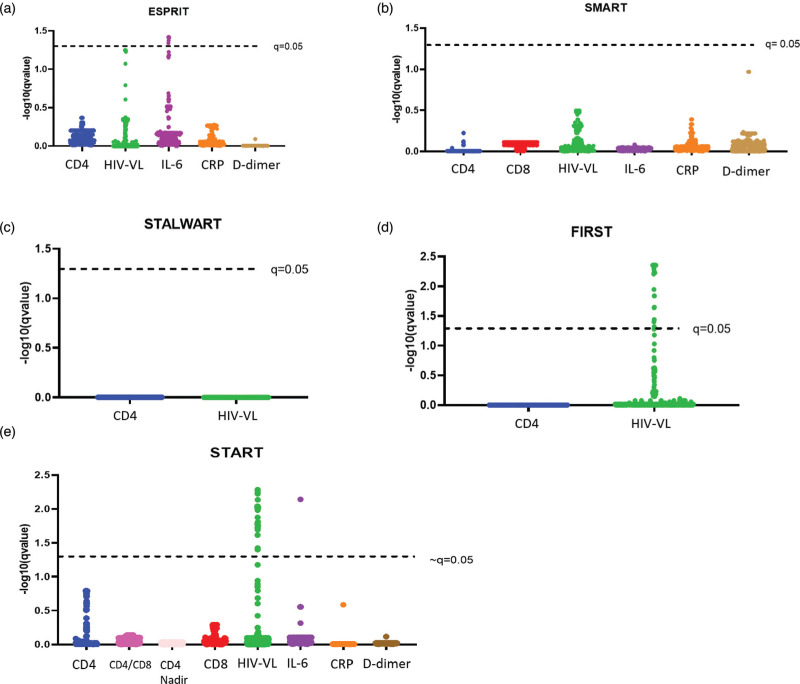
Fig. 1.
Associations between SNPs and markers of HIV pathogenesis.
Q-values were −log10 transformed and plotted on the y-axis; higher values denote smaller q-values, and stronger evidence for the presence of an association. SNPs are grouped by associations to a specific marker of interest and plotted on the x-axis. Each dot represents a single SNP. Associations are considered significant with q-value <0.05.

