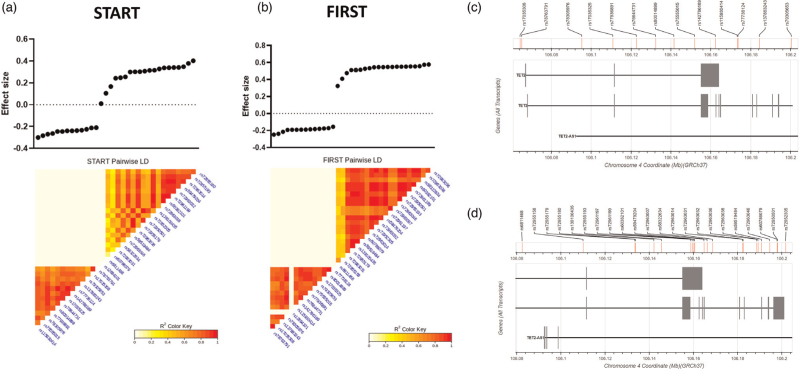
Fig. 2.
Pairwise linkage disequilibrium (LD) analysis of SNPs significantly associated with VL in the START (a) and/or FIRST (b) cohorts.
The LD shows two distinct clusters of SNPs in both studies, consisting of SNPs that are associated with lower VL (on the left), and those associated with higher VL (on the right). All TET2 SNPs that associated with higher VL in START are also associated with higher VL in FIRST. Likewise, TET2 SNPs that associated with a lower VL in START are also associated with a lower VL in FIRST. LD is measured using R2 of each SNP pair; darker colour denotes stronger associations. (c) TET2 SNPs associated with lower VL are spread out across the TET2 gene. (d) TET2 SNPs associated with higher VL tend to cluster towards the 5’ end of TET2. TET2, ten-eleven methylcytosine dioxygenase 2; VL, viral load.

