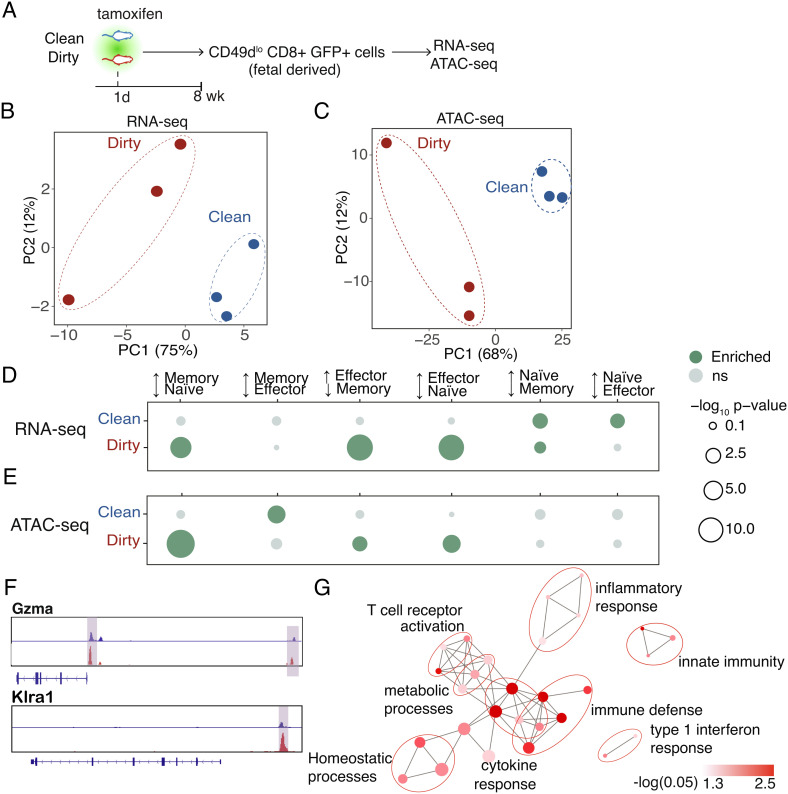
Fig. 4.
Dirty fetal-derived cells lose their naive programming. (A) Schematic of sorting strategy. (B) Principal component analysis of genome-wide sequencing from RNA- and (C) ATAC-sequencing data sets. (D) Enrichment analysis for various CD8+ T cell states in genes with increased expression and/or (E) increased accessibility in clean and dirty cells. (F) Genome browser views of a dirty-upregulated gene and a dirty-poised gene. (G) Enrichment analysis for GO “biological process” terms in dirty-poised genes. Pathways are connected if they share 30% or more genes. Node sizes denote gene set sizes. Statistical significance of differential expression and differential accessibility was determined by the Wald test (D) and quasilikelihood F test (E) with Benjamini–Hochberg correction (P < 0.05). Corrected P-values for enrichment or depletion denoted by dot size and color. Enrichment values in D and F were determined by a hypergeometric test followed by Benjamini–Hochberg correction. (P < 0.05).

