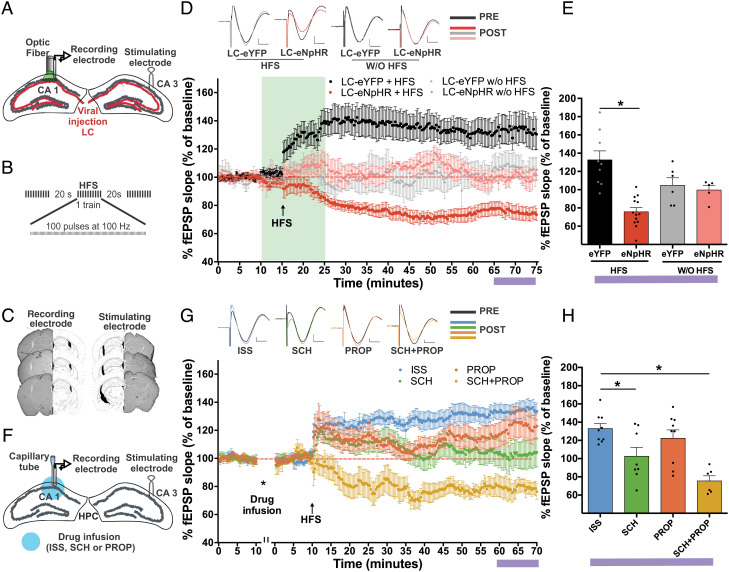
Fig. 5.
Associated modulation of DA and NA regulates the threshold of LTD/LTP after HFS. A. Schematic infusion of eNpHR or eYFP in the LC, and implantation of a fiber optic and recording electrode in the hippocampal CA1 region and a stimulating electrode in the hippocampal CA3 region. B. HFS protocol (three trains of 100 pulses at 100 Hz). C. Histology of coronal brain sections of the hippocampal CA1 (recording electrode) and CA3 (stimulating electrode) regions. D. Response as the percent slope of fEPSP in the LC-eNpHR+HFS (n = 13), LC-eYFP+HFS (n = 9), LC-eNpHR+W/OHFS (n = 5), and LC-eYFP+W/O HFS (n = 6) groups. Representative traces of EPSP before (PRE) and after exposure to the laser (POST) (green bar, 573 nm at 10–15 mW from the fiber optic tip to continuous pulse for 15 min). E. Representative graph of the last 10 min (purple bar) of the % EPSP slope. F. Schematic of drug infusion and the recording electrode in the hippocampal CA1 region and the stimulating electrode in the hippocampal CA3 region. G. Response in % fEPSP slope after HFS administrated with ISS (n = 9), SCH23390 (SCH, n = 8), PROP (n = 9), or SCH with PROP (SCH+PROP, n = 6). Representative traces of EPSP before (PRE) and after HFS (POST) (horizontal bar: 5 ms, vertical bar: 200 mV). H. Representative graph of the last 10 min (purple bar) of the % fEPSP slope. All results show the mean % fEPSP slope of baseline ± SEM. ns: not significant; *P < 0.05.

