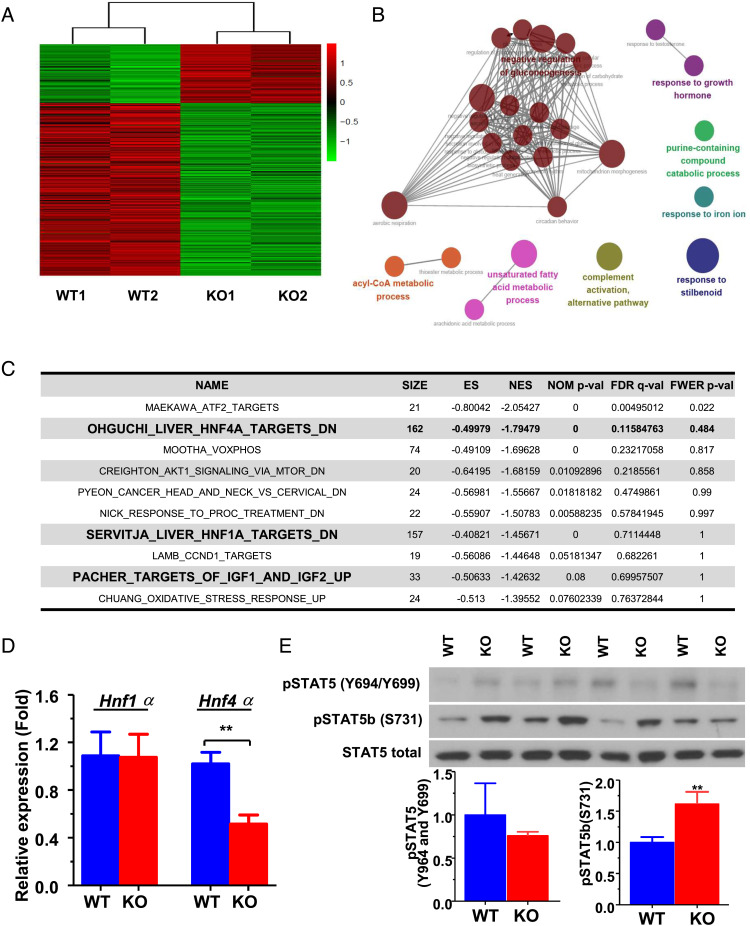
Fig. 6.
Transcriptomic analysis in the liver from adult WT and Jazf1 KO mice fed regular chow. (A) Heatmap for the differentially expressed genes between WT and KO mouse liver. (B) Enrichment map: commonality of positive enrichments in the gene ontology (GO) gene sets after GSEA assessment using the 108 up-regulated genes in Jazf1 KO mouse liver. (C) The list of top ten enriched CGP gene sets in Jazf1 KO liver with enrichment score (ES), the nominal P-value (NOM P-val), and false discovery rate (FDR Q-val). (D) The mRNA expression of Hnf1α and Hnf4α in the liver from WT and Jazf1 KO mice fed regular chow. (E) Phosphorylation of STAT5B protein in the liver from adult WT and KO mice fed regular chow. N = 4–5 for each group. All data are mean ± SEM for panel D and E. *P < 0.05, **P < 0.01 by two-tailed Student's t test.

