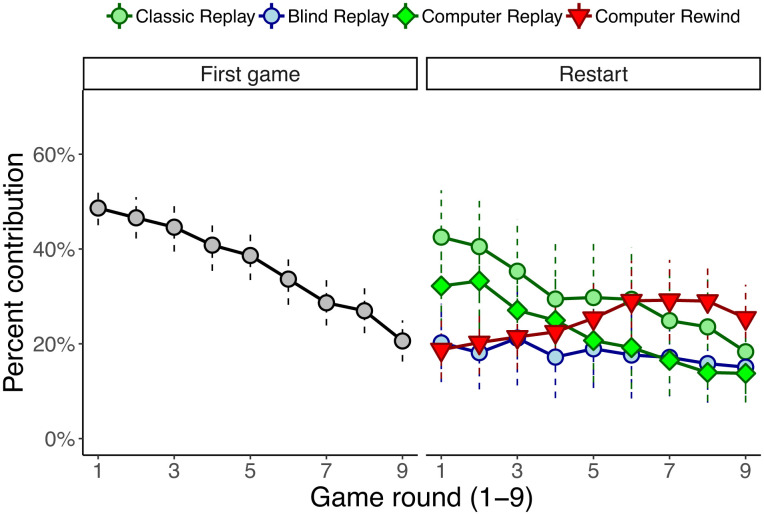
Fig. 2.
Restart effects. Data show the mean contributions for the first game for all groups (N = 80 groups, grey circles); or for when individuals simply replayed the same game according to their randomly assigned restart treatment (Fig. 1). Dashed vertical lines show 95% confidence intervals based on group mean contributions. N = 20 groups for each restart treatment.

