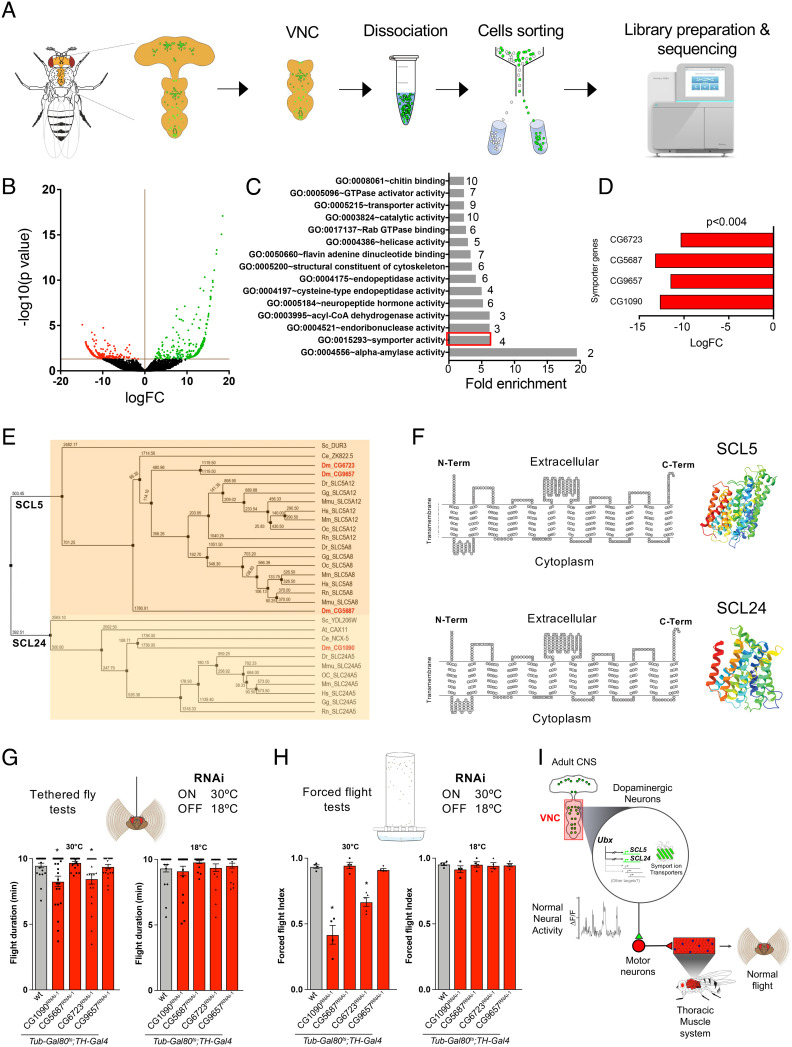
Fig. 6.
SLC gene symporter genes are differentially expressed in response to Ubx downregulation in TH neurons. (A) Experimental design of our neuron-specific transcriptomic experiment. (B) Volcano plot depicting differentially expressed genes (DEGs). Red and green dots represent down- and upregulated genes, respectively. (C) Gene Ontology (GO) enrichment analysis. GO molecular functions of DEGs show the top four genes (red bar) predicted to have symporter activity (involvement in calcium, potassium, sodium and/or solute co-transport). (D) The four differentially expressed symporter genes are strongly downregulated. None of these genes has been previously characterized in flies. (E) Dendrogram of the differentially expressed symporter genes detected in Drosophila showing their relation to other gene families across the animal kingdom. The analysis suggests that the differentially expressed symporter genes belong to the human SLC5 and SLC24 protein families. Abbreviations are: Saccharomyces cerevisiae (Sc), Arabidopsis thaliana (At), Danio rerio (Dr), Gallus gallus (Gg), Homo sapiens (Hs), Macaca mulatta (Mm), Oryctolagus cuniculus (Oc), Rattus norvegicus (Rn), Mus musculus (Mmu) Drosophila melanogaster (Dm), Caenorhabditis elegans (Ce) (values near/above internodes correspond average of branch lengths from T-Coffee analyses). (F) Structural predictions for the symporter proteins encoded by differentially expressed symporter genes based on human SLC5A8 and SLC24A5. Left panel: SACS MEMSAT2 graphs predicting 13 and 12 transmembrane domains for symporter proteins SLC5 and SLC24, respectively. Right panel: predicted 3D structures of SLC5 and SLC24 proteins. (G and H) Conditional downregulation of symporter genes CG1090 and CG6723 in TH neurons affects flight maintenance in tethered flies (G) and ability in forced flight experiments (H). (I) Proposed cellular and molecular model of Ubx-dependent control of flight behavior in Drosophila. Error bars in figures represent SEM. Significant values in all figures based on Mann–Whitney U test or one-way ANOVA with the post hoc Tukey–Kramer test: ∗P < 0.05.

