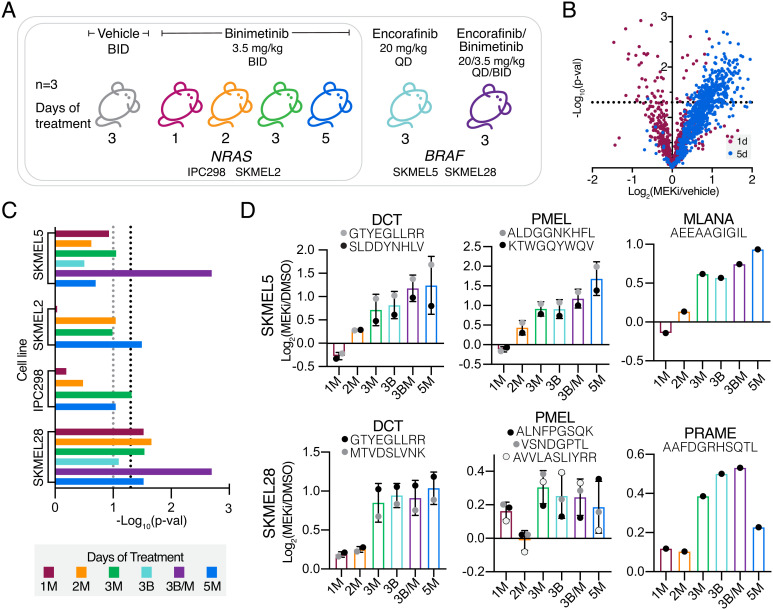
Fig. 2.
In vivo analysis of TAA pMHC enrichment in CLXs. (A) Experimental setup for CLX studies of mice + binimetinib or encorafinib. X-axis describes days of therapy and drug treatment (M = MEKi, binimetinib and B = BRAFi, encorafinib). (B) Volcano plot, average fold change in pMHC expression with binimetinib treatment (n = 3 biological replicates for DMSO and MEKi treated cells) versus significance (mean-adjusted P value, unpaired two-sided t test) for IPC298 CLX. (C) TAA enrichment significance values for each analysis. Black dotted line represents P ≥ 0.05, gray = P ≥ 0.01. (D) Average changes in pMHC expression for select melanoma differentiation antigens (n = 3 mice per condition). Errors bars represent SD when >1 peptide from each source protein was identified.

