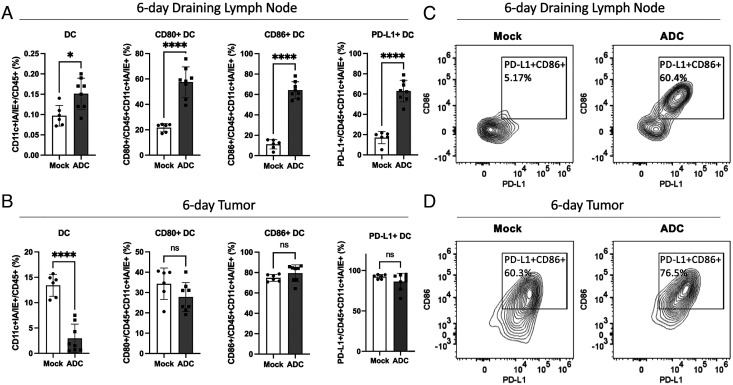
Fig. 7.
ADC treatment activated DCs and enhanced their migration from tumors to draining lymph nodes. Experiments were performed similarly to Fig. 5 B and D. Six days after the first treatment, cells from draining lymph nodes (A) and tumors (B) were analyzed by flow cytometry focusing on DCs (CD11c+IA/IE+). Data are shown as the mean ± SD and individual values. Mock: n = 6, ADC: n = 8. ns: not significant, *P < 0.05, ****P < 0.0001 (student’s t test). (C and D) Representative FACS plots of CD86 and PD-L1 expression levels on DCs from draining lymph nodes (C) and tumors (D).

