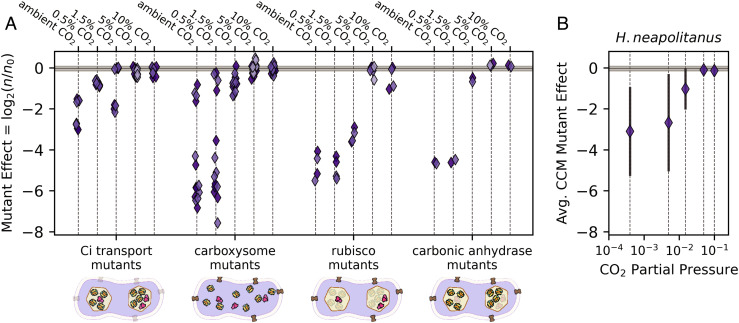
Fig. 2.
H. neapolitanus CCM genes contribute to growth even in super-ambient CO2 concentrations. H. neapolitanus is a chemoautotroph that natively utilizes a CCM in low CO2 environments. We profiled the contributions of CCM genes to autotrophic growth across a range of CO2 levels by assaying a barcoded transposon mutant library (20) in sequencing-based batch culture competition assays (Methods). Mutational effects were estimated as the log2 ratio of strain counts between the end point sample (e.g., 0.5% CO2) and the 5% CO2 preculture for each barcoded mutant (20, 28). As the library contained an average of ≈40 mutants per CCM gene, each point in (A) gives the average effect of multiple distinct mutants to a single CCM gene in a given CO2 condition. A value of log2(n/n0) = −2 therefore indicates that gene disruption was, on average, associated with a fourfold decrease in mutant abundance as measured by Illumina sequencing of mutant strain barcodes (20, 28). Negative values indicate that the gene, e.g., the carboxysomal CA, contributes positively to the growth of wild-type H. neapolitanus in the given condition. Observed log2(n/n0) values indicated that many H. neapolitanus CCM genes contribute to growth in super-ambient CO2 concentrations, including genes coding for Ci uptake, carboxysome shell proteins and the carboxysomal CA. Biological replicates are indicated by shading, and the gray bar gives the interquartile range of fitness effects for all ≈1700 mutants across all CO2 levels (−0.15-0.065). Replicates were highly concordant (SI Appendix, Fig. S2). “Ci transport mutants” include 4 DAB genes in two operons (20), “carboxysome” includes 6 nonenzymatic carboxysome genes, “rubisco mutants” denote the two subunits of the carboxysomal rubisco, and “CA mutants” denote the carboxysomal CA gene csosCA. H. neapolitanus also expresses a secondary rubisco, which explains why disruption of the carboxysomal rubisco is not lethal in high CO2 (SI Appendix, Fig. S3). Panel (B) gives the average mutational effect of CCM genes as a function of the CO2 concentration. Negative average values in 0.5-1.5% CO2 highlight the positive contribution of CCM genes to growth in these conditions. See SI Appendix, Figs. S2 and S3 for analysis of reproducibility and SI Appendix, Tables S1–S3 for detailed description of genes.

