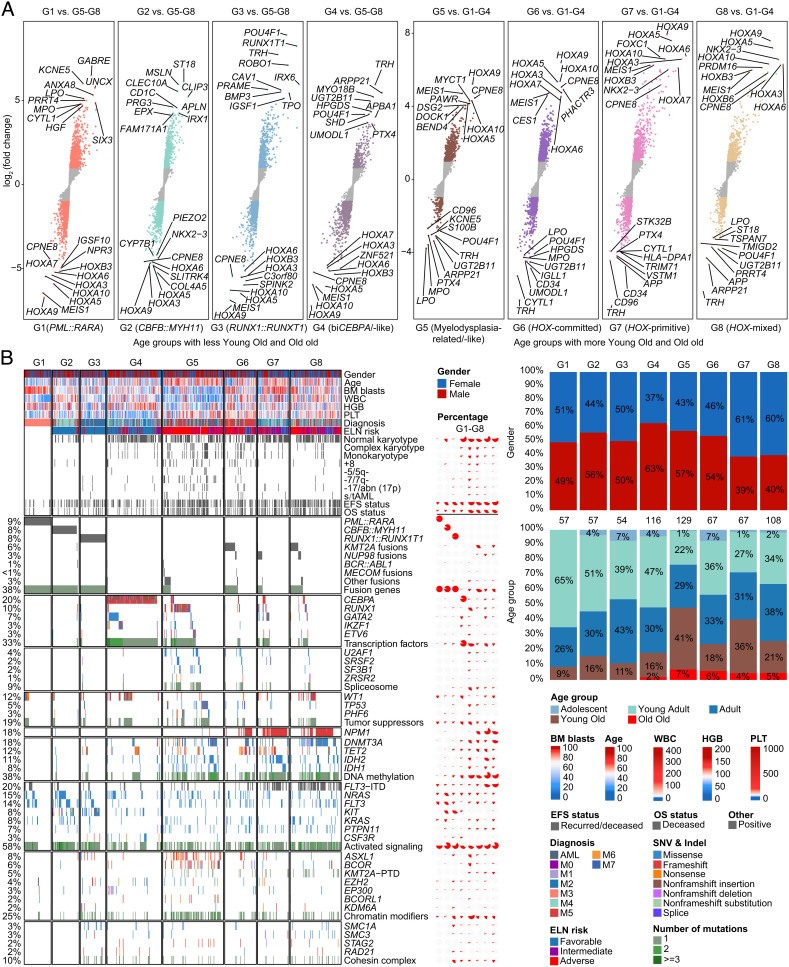
Fig. 2.
Clinical and molecular features of gene expression subgroups. (A) Differentially expressed genes between each subgroup in G1–G4 and G5–G8 as a whole (Left), and between each subgroup in G5–G8 and G1–G4 as a whole (Right). Each point represents a gene. All genes were ordered by the level of log2 (fold change) from low to high. (B) The Left panel shows clinical features, cytogenetic groups, outcomes, and recurrent gene fusions and mutations in AML, which are classified into diverse functional groups. Each column represents a patient, which is arranged according to the gene expression subgroup through G1–G8. The Middle panel depicts the percentage of clinical and molecular features in each subgroup. The Right panel presents the proportional distribution of gender (Upper) and age group (Lower).

