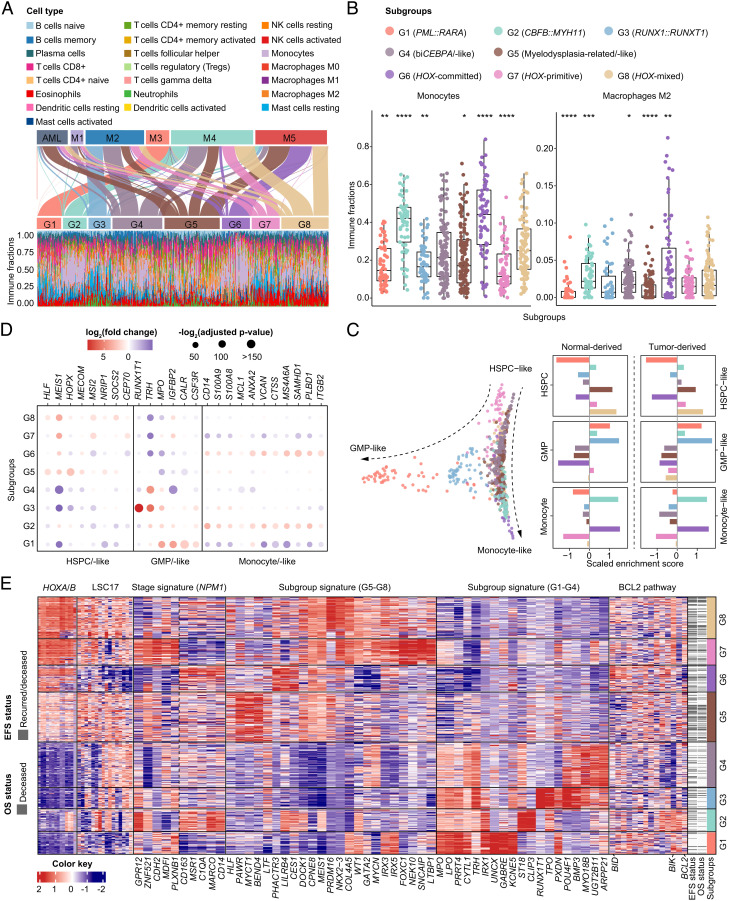
Fig. 3.
Cellular hierarchies and regulatory pathways of gene expression subgroups. (A) Sankey plot shows reclassification from FAB subtypes to the defined molecular subgroups (Upper). Immune infiltration with specific cell type abundance in each subgroup as determined by CIBERSORTx (Lower). (B) Comparison of immune fractions of monocytes and macrophages M2 in G1–G8 subgroups. *P < .05; **P < .01; ***P < .005; ****P < .001. (C) Diffusion map for visualization of distinct cell differentiation stages of gene expression subgroups through dimensionality reduction, using HSPC-like, GMP-like, and monocyte-like cell signatures derived from scRNA-Seq data reported by Galen et al. (Left). Enrichment score of differentiation stage markers in each subgroup, using normal-derived and tumor-derived markers from the same scRNA-Seq data (Right). (D) Deregulation of representative molecular markers of each cell type in the eight subgroups. (E) Heatmap of gene expression signatures, including HOXA/B family genes, LSC17 score (Ng et al.), NPM1 stage signatures (Mer et al.), subgroup signatures representing the most significant differentially expressed genes in G5–G8 and G1–G4, and BCL2 family genes in each molecular subgroup. Columns indicate patients and are arranged according to the gene expression subgroup through G1–G8. The red and blue color represents relatively high and low gene expression, respectively. FAB, French-American-British; GMP, granulocyte-monocyte precursors; HSPC, hematopoietic stem/progenitor cells; scRNA-Seq, single-cell RNA sequencing.

