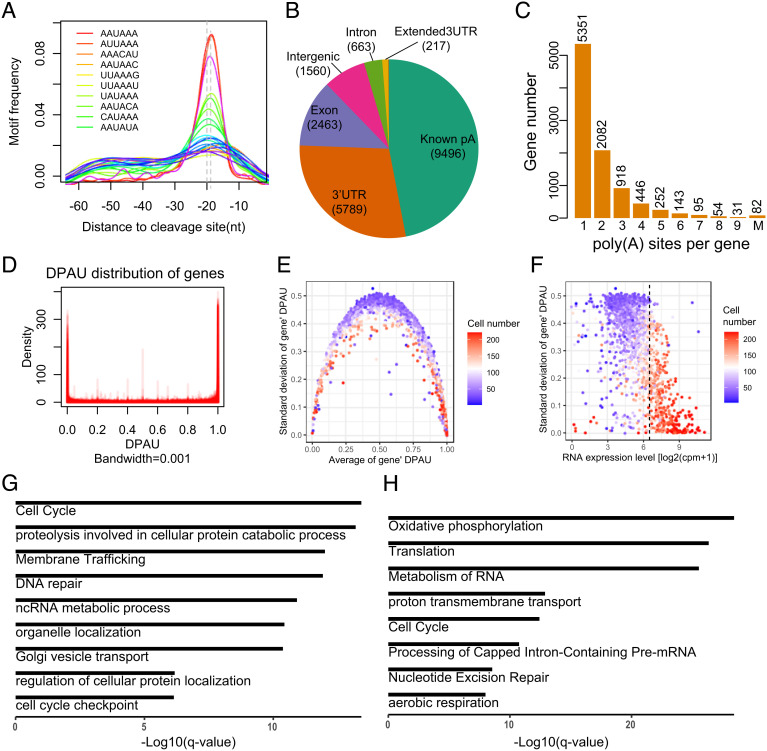
Fig. 2.
Features of polyA site usage at the single-cell level. (A) The enriched motifs near the detected polyA sites. (B) Genomic location annotation of polyA sites. (C) Histogram of the number of polyA sites per gene, with 43.4% genes containing more than one polyA site. (D) Density of DPAU showing genes with two polyA sites across cells showed a bimodal curve, indicating these genes tend to only use one polyA site in a specific cell. (E) The relationship between average of DPAU and the SD of DPAU for genes with two polyA sites. One dot denotes a gene. (F) Scatter plot of the mean expression level and standard variation of DPAU for genes with two polyA sites. Vertical line separates high- and low-expressed genes. One dot denotes a gene. (G) GO enrichment analyses of genes with the lowest expression level and the highest variation in polyA site usage. (H) GO enrichment analyses of genes with the highest expression level and the lowest variation in polyA site usage.

