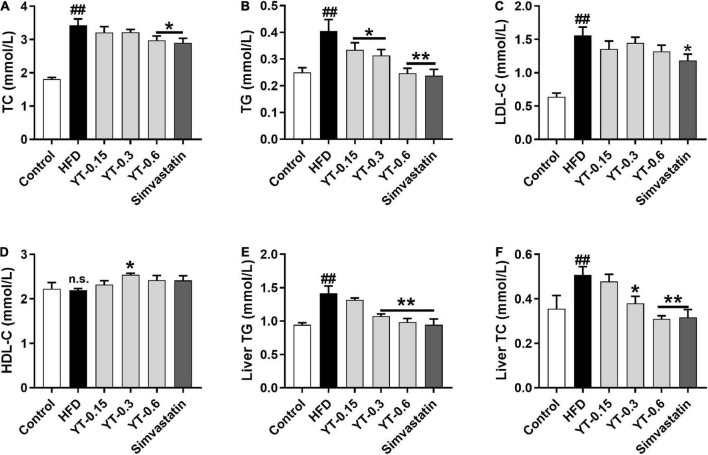
FIGURE 2.
Effect of YT extract on serum and liver biochemical indices. (A) TG, (B) TC, (C) LDL-C, (D) HDL-C, (E) liver TG, (F) liver TC. Data are presented as mean ± SEM (n = 6). #p < 0.05 and ##p < 0.01 vs. the control group; *p < 0.05 and **p < 0.01 vs. the HFD group; n.s. indicates no significant difference between the control and HFD groups.

