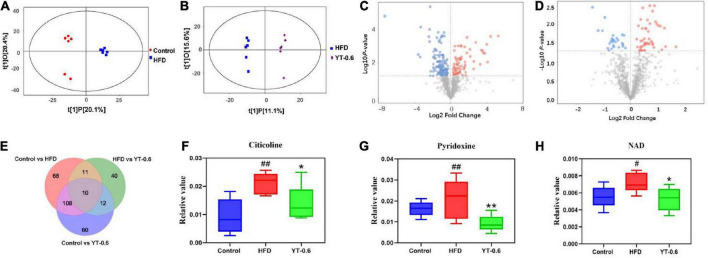
FIGURE 5.
YT extract altered the associated metabolic profiles in HFD-fed mice. (A) Orthogonal partial least squares discriminant analysis (OPLS–DA) of the control vs. HFD groups. (B) OPLS-DA of HFD-fed vs. the YT-0.6 g/kg group. (C) A volcano plot of control vs. HFD groups. (D) A volcano plot of HFD-fed vs. the YT-0.6 g/kg group. (E) Venn diagram of differential metabolites. (F) Three representative differentially expressed metabolites, #p < 0.05 and ##p < 0.01 vs. the control group; *p < 0.05 and **p < 0.01 vs. the HFD group.

