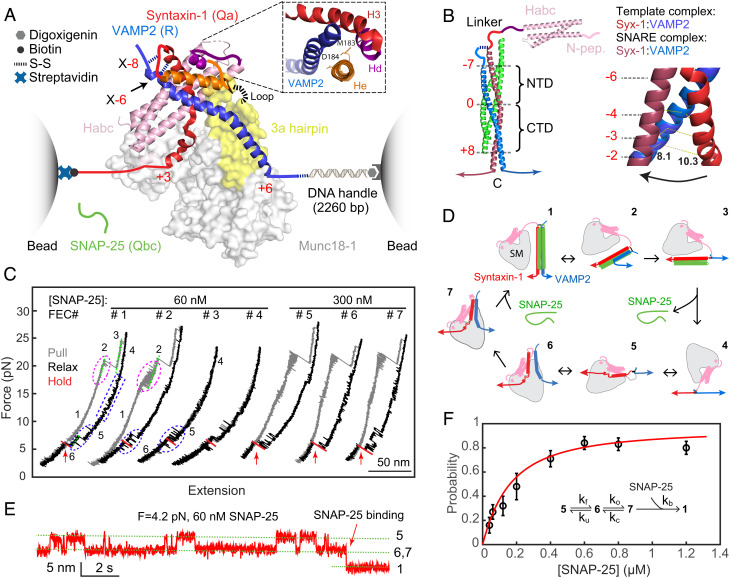
Fig. 1.
Single-molecule manipulation based on optical tweezers revealed an activated template complex nucleating SNARE assembly. (A) Experimental setup and cryo-EM structure of the template complex (PDB ID: 7UDB). Synatxin-1 and VAMP2 are cross-linked at either the −8 layer (X-8) or the −6 layer (X-6) as indicated. The 3a helical hairpin of Munc18-1 (yellow) is the primary VAMP2 binding interface, with the disordered loop region at the tip indicated by a dashed line. The Inset shows the N-terminal four-helix bundle, with syntaxin-1 M183 and D184 in the He helix located in the binding interface. (B) Structure of the fully assembled SNARE complex containing the SNARE four-helix bundle (PDB ID: 1SFC) and the syntaxin Habc domain (PDB ID: 1BR0) (Left) and different helical conformations of N-terminal SNARE motifs of syntaxin-1 and VAMP2 in the template complex and the SNARE four-helix bundle (Right). The characteristic layers are labeled in red numbers. The middle ionic layer, or “0” layer, divides the SNARE four-helix bundle into the NTD and the CTD. In the Right panel, the distances between the two residues at the −2 layer are labeled. (C) FECs obtained by repeatedly pulling (gray) and relaxing (black) a single Syx-VAMP conjugate or holding at a constant trap separation (red) in the presence of Munc18-1 and SNAP-25 in the solution. The states associated with different FEC regions are labeled (see D), and the SNAP-25 binding events are indicated by red arrows. (D) Diagrams showing different SNARE folding/assembly and Munc18-1 binding states and their transitions (black arrows): 1, the fully assembled SNARE four-helix bundle; 2, the half-zippered SNARE bundle; 3, the unzipped t- and v-SNAREs; 4, the fully unfolded SNAREs; 5, Munc18-1-bound open syntaxin; 6, the inactive template complex; 7, the activated template complex. (E) Extension-time trajectories at constant trap separation or mean force showing reversible folding and unfolding transition of the template complex and irreversible SNAP-25 binding. (F) The probability of SNAP-25 binding to the template complex as a function of SNAP-25 concentration (symbol) and its best model fit (red curve). Each probability was derived from more than 30 independent measurements (N), with the arrow bars indicating the SD. The Inset shows the reaction scheme and the associated rate constants (SI Appendix).

