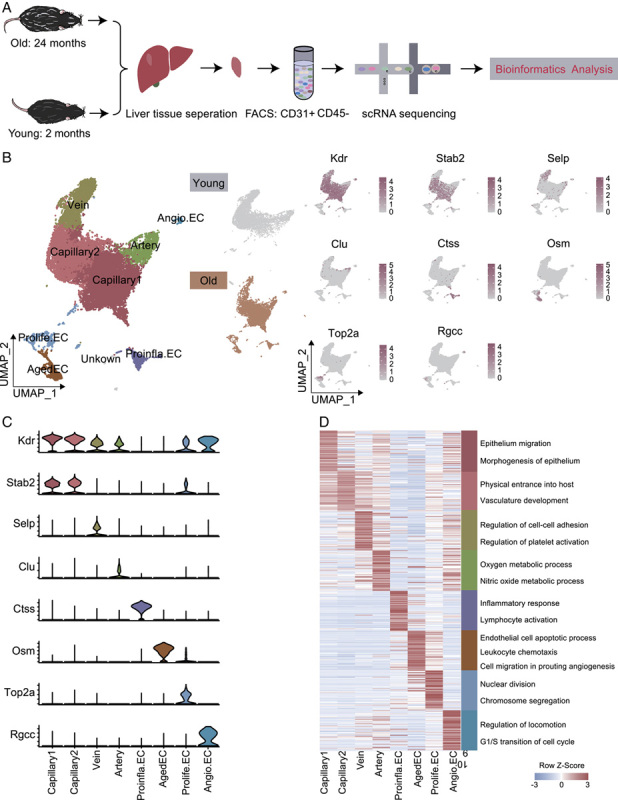
FIGURE 1.

Construction of single-cell transcriptomic atlas of mouse liver endothelial cells (ECs). (A) Flow chart of scRNA-seq and bioinformatics analysis of mouse liver ECs. Young, n=3; old, n=4 mouses. (B) Left, UMAP plot showing the distribution of different cell types in mouse liver ECs. Middle, UMAP plots showing the distribution of different EC subpopulations in young (top) and old (bottom) mice. Right, UMAP plots showing the expression of representative marker genes for the corresponding cell types in mouse liver ECs. (C) Expressions of Kdr, Stab2, Selp, Clu, Ctss, Osm, Top2a, and Rgcc in each cluster. y axis represents log-normalized expression. (D) Heatmap of gene expression of the top 50 marker genes for each EC subcluster with their enriched functional annotations on the right. Abbreviations: Aged EC, aged capillary EC; Angio.EC, angiogenic capillary EC; Prolife.EC, proliferating capillary EC; Proinfla.EC, pro-inflammation capillary ECs.
