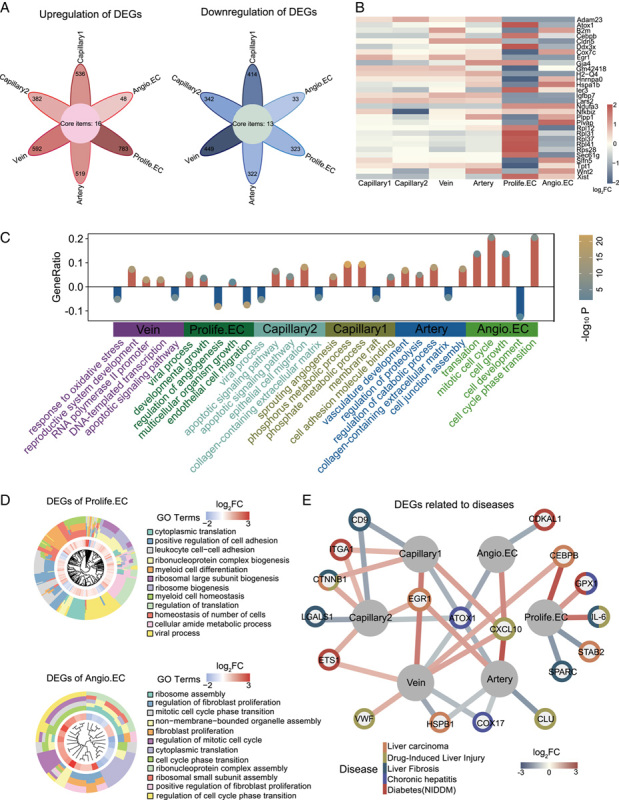
FIGURE 2.

Cellular and molecular aging characteristics of aged mouse liver endothelial cells (ECs). (A) Flower plot showing aging-related up-regulation and down-regulation of DEGs in different cell types in mouse liver ECs (adjusted p-value <0.05, |log2FC| > 0.25). Core items represent commonly DEGs in 6 subclusters. (B) GO terms enriched for aging-related DEGs in different cell types from mouse liver ECs in a bar plot. The Y-axis represents the proportion of differentially expressed genes in the total DEGs in corresponding terms. (C) Heatmap showing DEGs expressed by at least two cell types in mouse liver ECs. (D) Circle graph showing various effects of DEGs on different cell types during aging. (E) Network plot showing DEGs associated with liver disease in different EC cell types in mouse liver. Abbreviations: Angio.EC, angiogenic capillary EC; DEGs, differentially expressed genes; GO, gene ontology; Prolife.EC, proliferating capillary EC.
