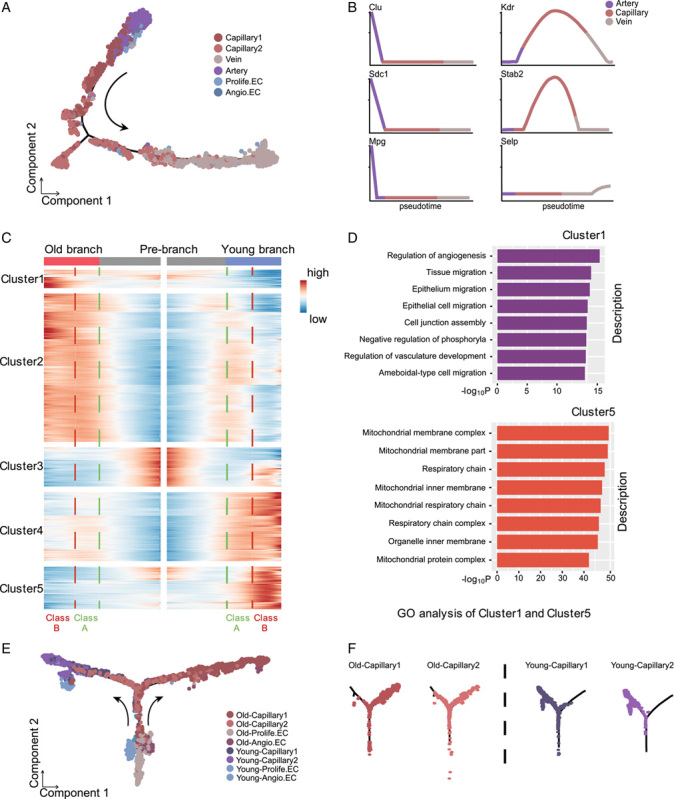
FIGURE 3.

Pseudo-time trajectories of liver endothelial cells (ECs) phenotypes in young and old mice. (A) Pseudo-time trajectory of the phenotype of young liver ECs. (B) Gene expression dynamic of representative marker genes enriched in different EC phenotypes along the artery-capillary-vein axis. (C) Gene expression heatmap of 1025 top capillary DEGs (coded into 5 clusters, q value <1×10⁻⁴). Old and young liver ECs trajectories (including prebranch) are shown on the right and left, respectively. Class A and B indicate DEGs in the early and late stages after the prebranch, respectively. (D) GO analysis of class A DEGs in clusters 1 and 5, indicating the earliest transcriptomic events during aging. (E and F) Pseudo-time analysis of capillaries (including capillary 1 and capillary 2) in young and old mouse liver ECs. The dots are colored by cell types (left) and trajectory dot plots are divided by age and cell type (right). Abbreviations: Angio.EC, angiogenic capillary EC; DEGs, differentially expressed genes; GO, gene ontology; Prolife.EC, proliferating capillary EC.
