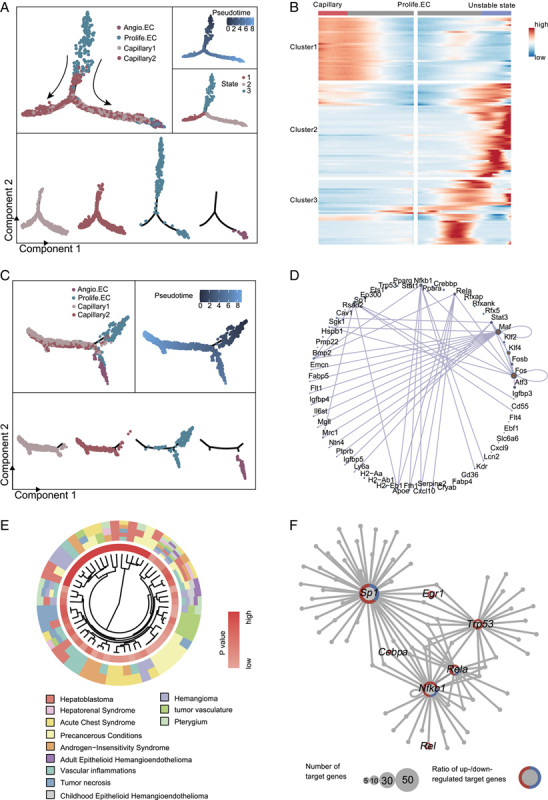
FIGURE 4.

Pseudo-time trajectory analysis of capillaries in young and old liver. (A) Pseudo-time analysis of capillaries (including capillary 1, capillary 2, Prolife.ECs, and Angio.ECs) in young mouse liver endothelial cells (ECs). Cells are colored by cell types (top) and segmented by different cell types (bottom). (B) Heatmap showing the expression profiles of the top 130 TDGs (q value <1×10⁻⁴) that were significantly changed in pseudo-temporal order after the prebranch, and then grouped into 3 clusters by expression pattern. (C) Pseudo-time analysis of capillaries (including capillary 1, capillary 2, Prolife.ECs, and Angio.ECs) in old mouse liver ECs. Cells are colored by cell types (top) and segmented by different cell types (bottom). (D) Network diagram showing transcriptional regulators of the top 130 TDGs. (E) Circle plots showing the top 130 TDGs associated with liver carcinoma. (F) Network plot showing transcriptional regulators of aging-related DEGs in Prolife.ECs in mouse liver. Node size indicates the number of target genes. The outer circle of the node represents the proportion of upregulated (red) and downregulated (blue) target genes regulated by the corresponding transcriptional regulators. Abbreviations: Angio.EC, angiogenic capillary EC; DEGs, differentially expressed genes; Prolife.EC, proliferating capillary EC.
