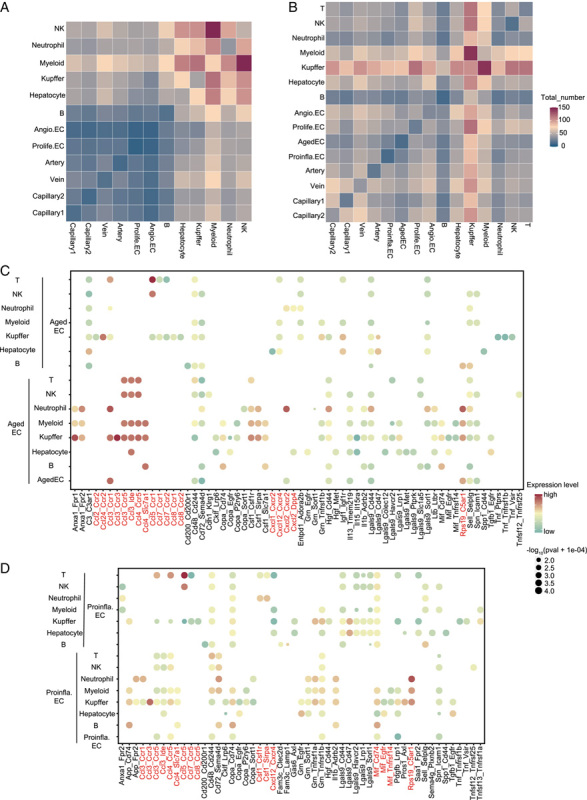
FIGURE 5.

CellPhoneDB analysis of cell-cell interaction in young and old hepatic vascular niche. (A) Heatmap showing the total number of interactions between cell types in the young hepatic vascular niche. (B) Heatmap showing the total number of interactions between cell types in the old hepatic vascular niche. (C) Cell-cell interaction analysis between Aged EC and the indicated cell types in the old hepatic vascular niche. Ligand-receptor pairs are labeled on the x-axis. p Values are indicated by the circle sizes while different colors represent different expression levels of ligands and receptors. We carried out an mRNA assay to extrapolate protein interactions. (D) Cell-cell interaction analysis between Proinfla.EC and the indicated cell types in the old hepatic vascular niche. Ligand-receptor pairs are labeled on the x-axis. p Values are indicated by the circle sizes while different colors represent different expression levels of ligands and receptors. We carried out the mRNA assay to extrapolate protein interactions. Abbreviations: Aged EC, aged capillary EC; Angio.EC, angiogenic capillary EC; Prolife.EC, proliferating capillary EC; Proinfla.EC, pro-inflammation capillary ECs.
