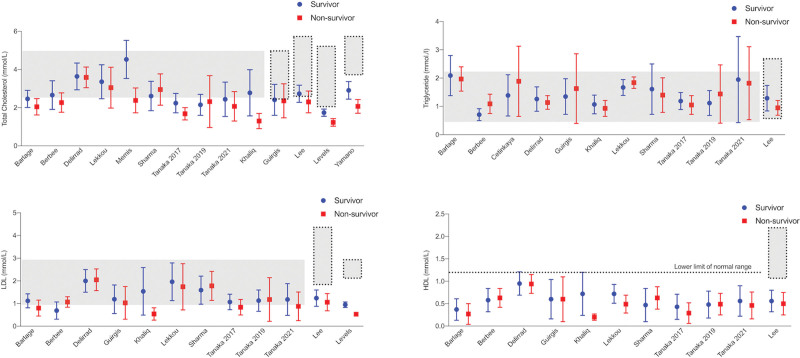
Figure 2.
Comparison of total cholesterol, high-density lipoprotein (HDL)-cholesterol, low-density lipoprotein (LDL)-cholesterol, and triglyceride levels in eventual survivors and nonsurvivors by study. Dotted lines represent normal laboratory ranges, where reported in the studies. Horizontal gray bars represent normal laboratory ranges of the author’s institution. All values are demonstrated as mean and sd.

