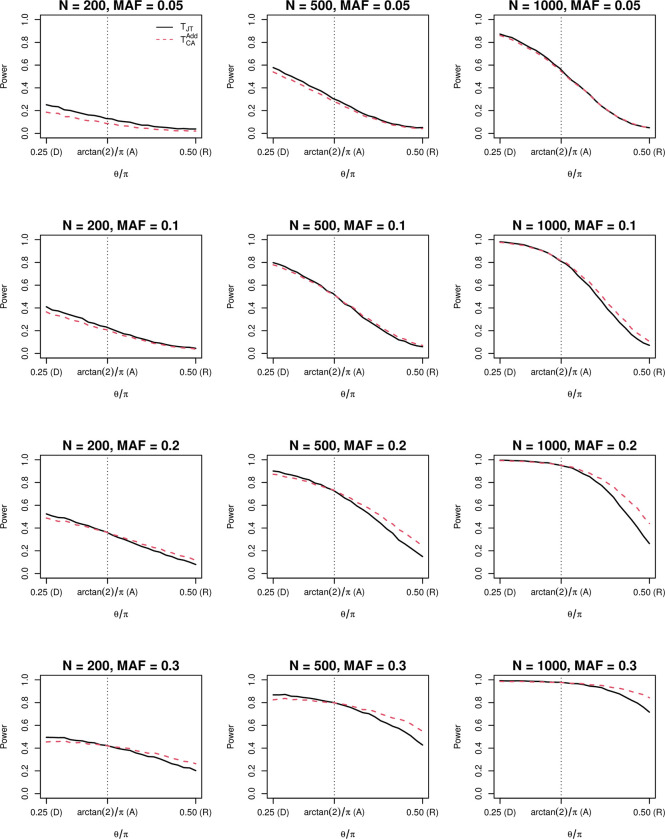
Fig 1. Power comparison between the Jonckheere-Terpstra trend test (TJT) and the Cochran−Armitage trend test .
The black solid line denotes TJT and the red dashed line denotes . Along the x-axis, θ = π/4, arctan 2, and π/2 correspond to dominant (D), additive (A), and recessive (R) genetic models, respectively. The y-axis is the average empirical power at the 0.05 level based on 10,000 replicates each. The disease prevalence equals 0.1. MAF: minor allele frequency.

