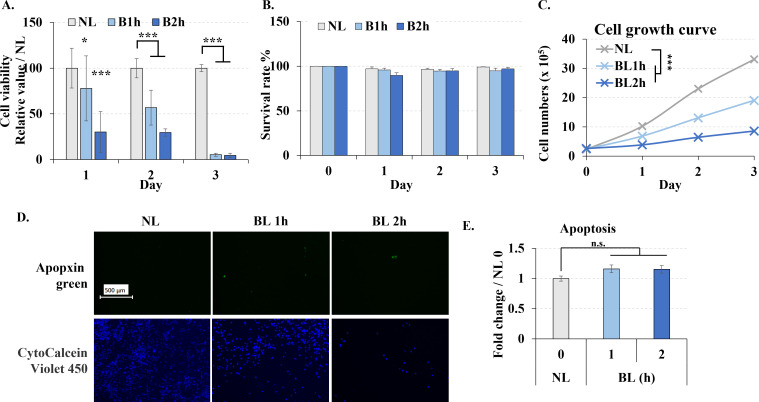
Fig 1. Blue light effect on the viability of B16F10 melanoma cells.
Cells were treated with blue light (0, 1, and 2 h / day) for 3 days. A. Cell viability measured by MTT assays each day. B. Cell survival rate measured by trypan blue assays each day. C. Cell were irradiated once, returned to the dark incubator, and cell numbers were counted by cell counter every following day. D. Cells were immediately stained with apopxin green (apoptosis) and CytoCalcein Violet 450 (live cell) after the last irradiation, and images were taken with a fluorescent microscope. Scale bar, 500 μm. E. Fluorescence values for green were analyzed by image J. NL: non-light treatment; BL: blue light irradiation; B1h, B2h: blue light irradiation 1, 2 hours. The results are presented as the mean ± SD; n ≥ 3; *p < 0.05, ***p < 0.001 vs. NL 0.

