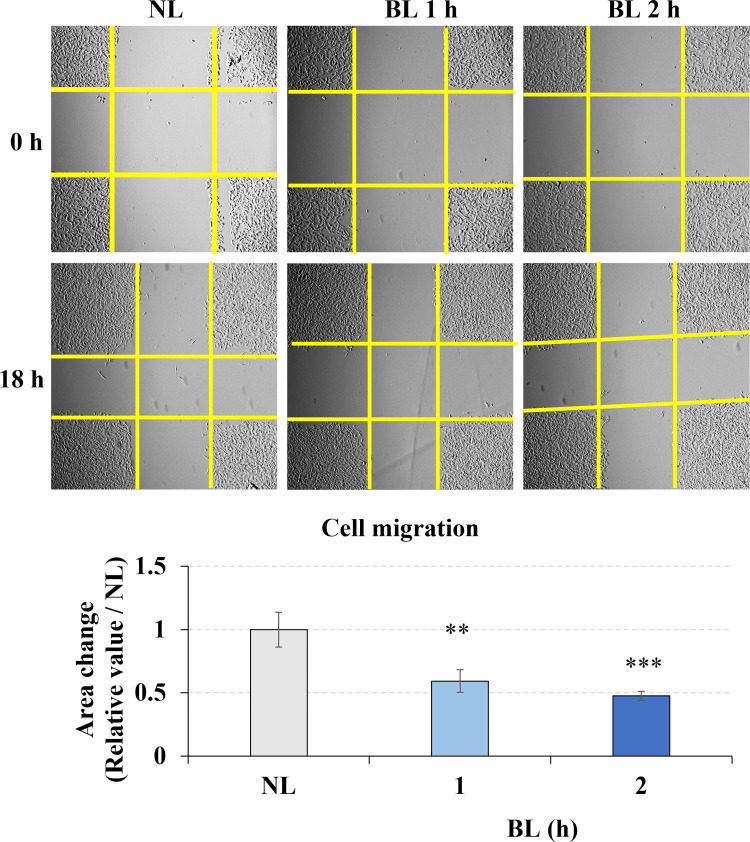
Fig 2. Blue light effect on the migration of B16F10 melanoma cells.
Cells were irradiated with blue light for 0, 1, or 2 h after preparing the gaps using pipet tips. Yellow lines labeled the area without cells. The images at 0 h and 18 h were taken and the area change of cross gap was analyzed by image J. The bar graphs show the chage of the area between 0 h and 18 h. NL: non-light treatment, BL: blue light irradiation. The results are presented as the mean ± SD; n ≥ 3; **p < 0.01, ***p < 0.001 vs. NL 0.

