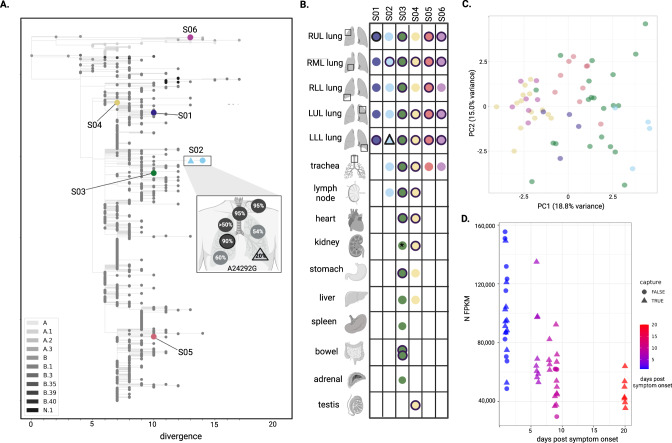
Fig. 3. Complete SARS-CoV-2 genomes across subjects and tissues.
A A maximum likelihood phylogenetic tree of the unique viral genomes identified, including two unique consensus genomes from S02, demonstrates genetic divergence. The viral sequences are presented in the context of 729 sequences from a six month window centered on the time these infections occurred, with color representing SARS-CoV-2 Pango lineage (legend). Inset, the SNP that differentiates unique genomes from S02 (A24292G) is highlighted; allele frequencies across all seven tissues from which a genome assembled are annotated (for two samples, black outline designates >500x mean depth coverage for high-confidence variant quantification). B A schematic representation of complete viral genomes assembled across the six subjects. Colored shapes represent the assembly of a complete genome, each unique color-shape combination represents a unique genome, which is represented in the phylogenetic tree. A black outline designates >500x mean depth coverage, suitable for minor variant and transcriptomic analysis. C Principal component analysis of viral fragment abundance for 32 unique samples (those with >500x mean depth of viral coverage, some being duplicate libraries), colored subject, demonstrate that samples separate in PC1 by time between symptom onset and death. D Nucleocapsid (N) gene expression, normalized by the total number of viral reads, decreased with time between symptom onset and death. Legends indicate day between symptom onset and death, and whether a sample underwent targeted enrichment.

