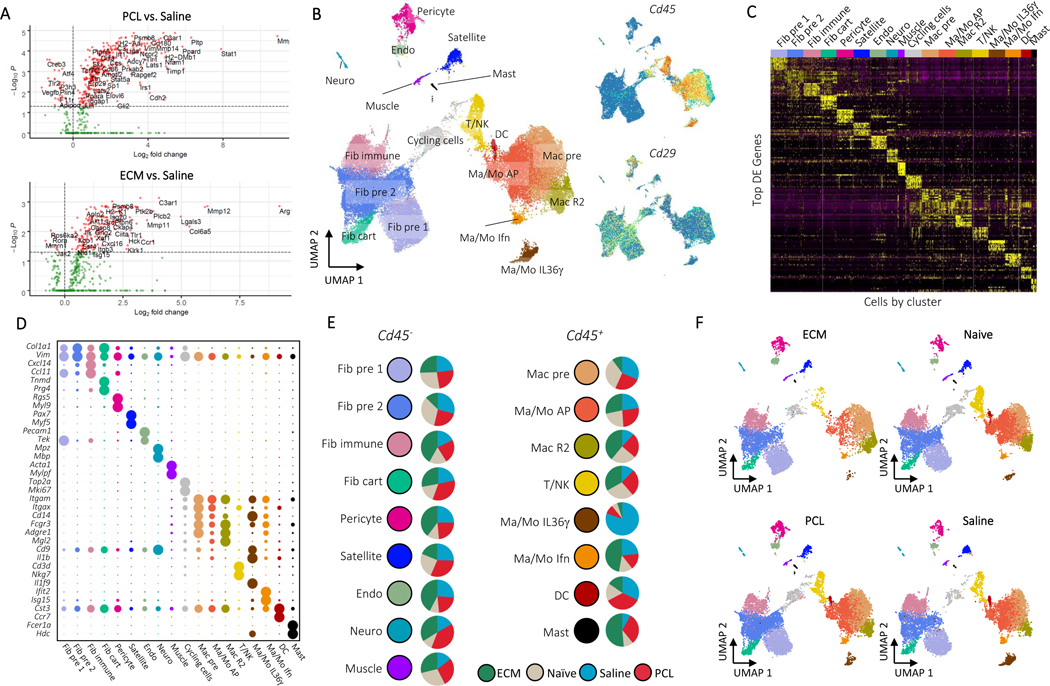
Figure 1: A Single Cell Atlas of the Biomaterials Immune Microenvironment.
A, NanoString gene expression analysis of mRNA isolated from whole muscle samples of animals treated ECM or PCL compared to saline treated animals. nSolver© software with default parameters was used for statistical testing with adjusted P ≤ 0.05 defining differential expression. B, Overview of cell clusters identified in the composite scRNAseq dataset. UMAP plots with cluster labels (left) and gene expression levels of Cd45 and Cd29 (right) are shown. C, Heatmap of up to 10 differentially expressed genes with highest log fold-change from each cluster. Cells are ordered and labeled by cluster with random sampling of up to 100 cells per cluster to ensure visibility of small clusters. D, Gene markers for single cell subsets. The dotplot shows expression of genes associated with cluster identity. Cluster averaged gene expression values after normalization to the maximum averaged expression are shown. E, Composition of cluster by condition. Cluster labels and colors are shown adjacent to pie charts of normalized number of cells by condition. Prior to comparison of conditions, cells were normalized to the total number CD45+ or CD45- cells by sample. The resulting values are compared across condition. Cycling cells are not shown. Only samples from non-sorted samples were used to calculate proportions (see methods). F, Visualization of cells by condition on UMAP. Each UMAP shows cells only from a given condition colored by cluster.

