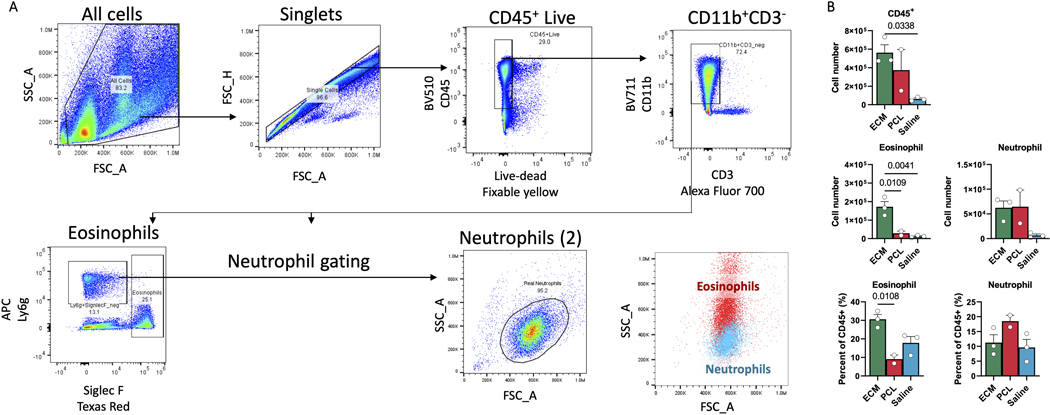
ED Fig. 5. Flow cytometry of neutrophils and eosinophils.
A, Cells were gated on scatter (FSC_A, SSC_A) followed by doublet discrimination (FSC_A, FSC_H), selection of CD45+ live cells (Fixable Yellow-, CD45+), and selection of myeloid cells (CD3-, CD11b+). This population was used to identify eosinophils (Ly6g low, Siglec F+) and neutrophils (Ly6g+, Siglec F-) of correct size (FSC_A, SSC_A). B, Numbers of CD45+ cells, eosinophils, and neutrophils from ECM, PCL, or saline treated animals one week after surgery (top). Eosinophil and neutrophil amounts as proportion of CD45+ cells are given below. Data are mean ± SEM. Statistics shown are after analysis of variance (ANOVA) followed by Dunnett’s multiple comparison testing where P is adjusted p value.

