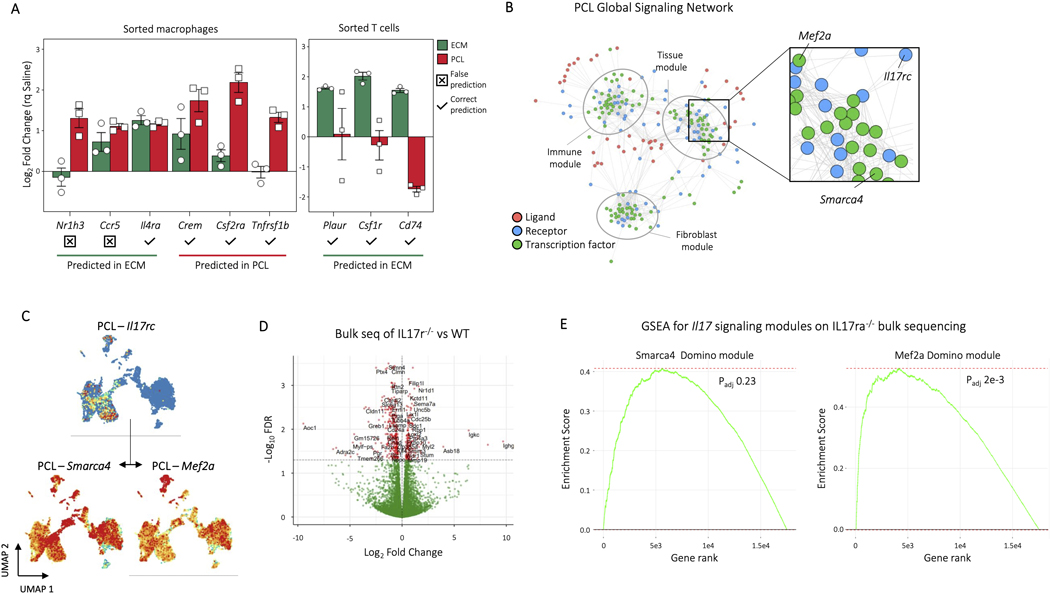
ED Fig. 9. In vivo validation of signalling predictions by Domino.
A, Nanostring gene expression profiling for receptors and transcription factors identified as enriched in either ECM or PCL for specific cell types. After identifying genes specific to either ECM or PCL within the myeloid or T cell populations in Domino, we used Nanostring to probe expression of those genes in sorted myeloid (CD45+CD11b+) or T cells (CD45+CD3+). Of the 9 genes found to overlap between Domino and Nanostring, 7 were predicted correctly and 2 incorrectly. Error bars are standard error. B, The Domino global signaling network for PCL as seen in Figure 5. The region surrounding the IL17 signaling pathway is enlarged and the components labeled. C, Expression of Il17rc and activation of it’s predicted transcription factor targets Smarca4 and Mef2a in the PCL signaling network. D, Volcano plot for bulk RNA sequencing of IL17ra−/− and wild type animals one week after VML. Direction of log fold change indicates expression in IL17ra−/− animals compared to wild type. An FDR threshold of 0.05 was used to designate genes as significant. E, Gene set enrichment analysis (GSEA) of Domino transcription factor modules predicted as downstream of IL17 in the PCL signaling network. Both modules predicted to interact are shown. Genes from the edgeR bulk RNA seq comparison with respect to wild type ordered by FDR were used to calculate enrichment for genes present in the Domino transcription factor modules. Movement of the running enrichment score (green line) above zero indicates enrichment of genes in the module in the statistically significant portion of expressed genes while movement below zero indicates enrichment of genes in the module in the lower FDR portion of the genes. P values calculated by GSEA adjusted by Benjamini-Hochberg correction are shown.

