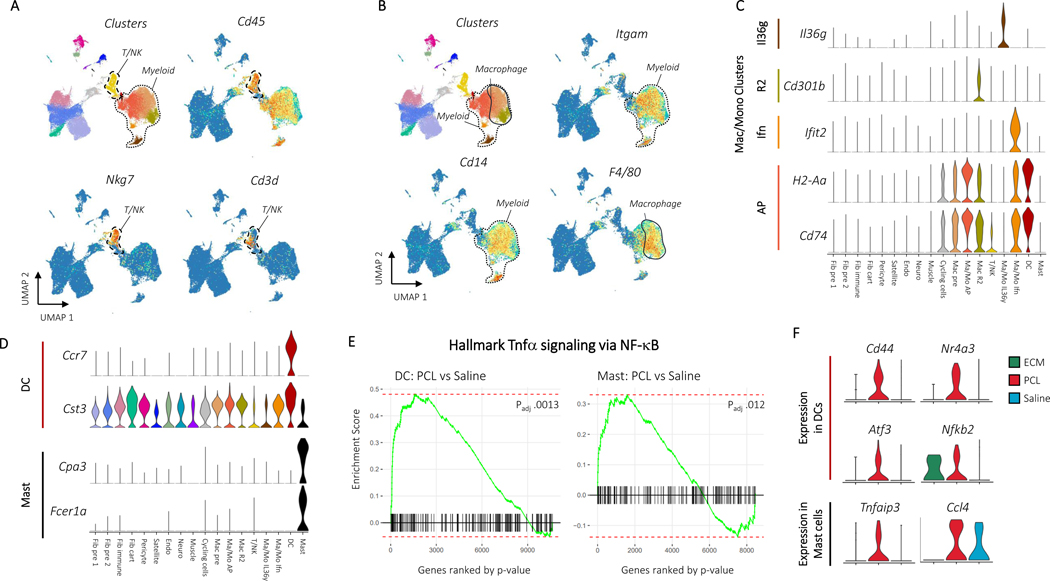
Figure 2: CD45+ cells drive inflammation in response to synthetic materials A, Immune markers for T and NK cells.
Clusters are shown adjacent to Cd45, Nkg7, and Cd3d gene expression. The T/NK cell cluster and myeloid clusters are circled with dotted outlines. B, Gene expression for myeloid and macrophage cell markers. Clusters are shown adjacent to Itgam, Cd14, and F4/80 gene expression. Myeloid and macrophage clusters are circled and labeled. Gene expression for cluster specific monocyte, macrophage, dendritic cell, and mast cell markers are then shown in C and D. E, Plots of enrichment scores comparing cells from differing conditions within myeloid clusters with the Broad Institute’s Hallmark TNFa signaling via NFkB gene set. Genes were ordered by –log(p) after differential expression with MannWhitney U test between PCL and Saline cells from the dendritic cell (left) or mast cell (right) clusters. A larger enrichment score indicates over-representation of the gene set within the differentially expressed genes and a negative score indicates under-representation. Adjusted pvalues are after Benjamini-Hochberg correction of p values from fgsea. F, Gene expression for leading edge genes from gene set enrichment analysis in E. Violin plots show expression for dendritic cells (top) or mast cells (bottom) grouped by treatment condition.

