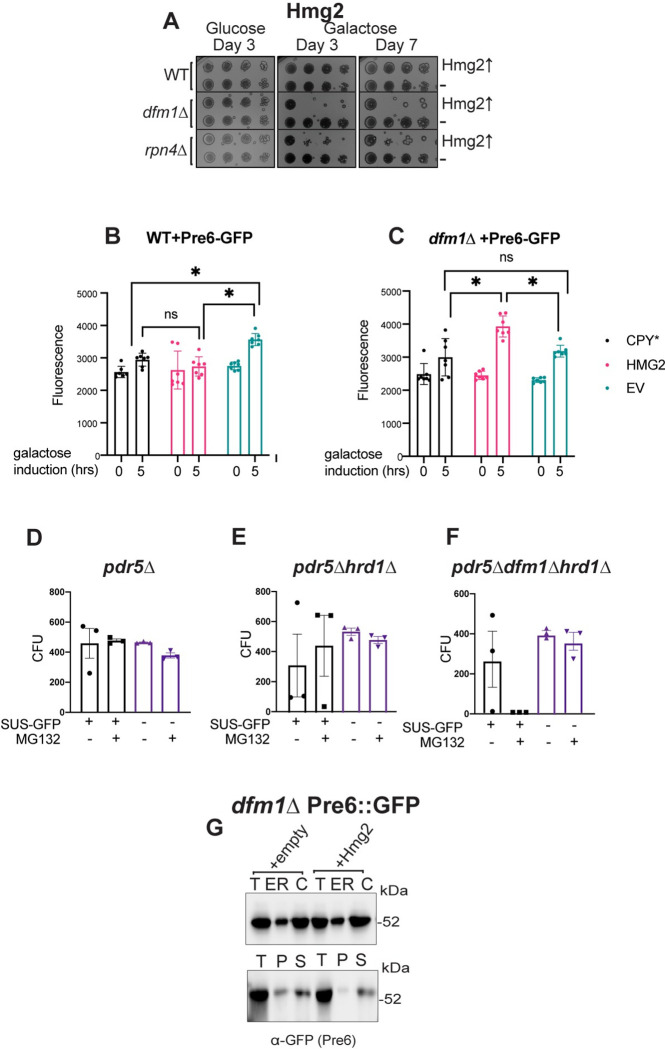
Fig 6. Misfolded membrane protein toxicity results in proteasome impairment.
(A) WT, dfm1Δ, and rpn4Δ cells containing either GALpr-HMG2-GFP or EV were compared for growth by dilution assay. Each strain was spotted 5-fold dilutions on glucose or galactose-containing plates to drive Hmg2-GFP overexpression, and plates were incubated at 30°C. Three biological replicates and 2 technical replicates (N = 3). (B) PRE6-GFP levels as measured by flow cytometry at 0 versus 5 hours post-galactose induction in WT cells containing either EV, GALpr-CPY*-HA, or GALpr-HMG2-GFP. (C) Pre6-GFP levels as in (B) except in dfm1Δ cells. (D) Quantification of CFUs formed on appropriate selection plates from proteasome sensitivity inhibition assay. pdr5Δ cells containing SUS-GFP or EV in log phase were treated with 25 uM of proteasome inhibitor MG132 or equivalent volume of DMSO for 8 hours and samples were diluted 1:500 and 50 uL of each sample was plated. (E) Proteasome sensitivity assay as in (D) except using hrd1Δpdr5Δ cells. (F) Proteasome sensitivity assay as in (D) except using dfm1Δhrd1Δpdr5Δ cells. Data information: For (B) and (C), all data are mean ± SEM, with 7 biological replicates (N = 7). For (D), (E), and (F), all data are mean ± SEM, 3 biological replicates and 2 technical replicates (N = 3); statistical significance is displayed as two-tailed unpaired t test, *P < 0.05, ns, not significant. (G) Western blot of Pre6 in cytosol versus ER (top panel) and aggregated (pelleted) versus non-aggregated (soluble) Pre6 at the ER (bottom panel). Lysates from dfm1Δ, cells containing Pre6-GFP and HMG2-6Myc or EV were blotted using anti-GFP to detect Pre6. T is total protein, ER is endoplasmic reticulum protein fraction, C is cystolosic protein fraction, P is pellet (ER aggregated) fraction, and S is soluble (ER non-aggregated) fraction. The data underlying this figure can be found in Table I–K in S1 Data (Sheet 2). CFU, colony-forming unit; EV, empty vector.

