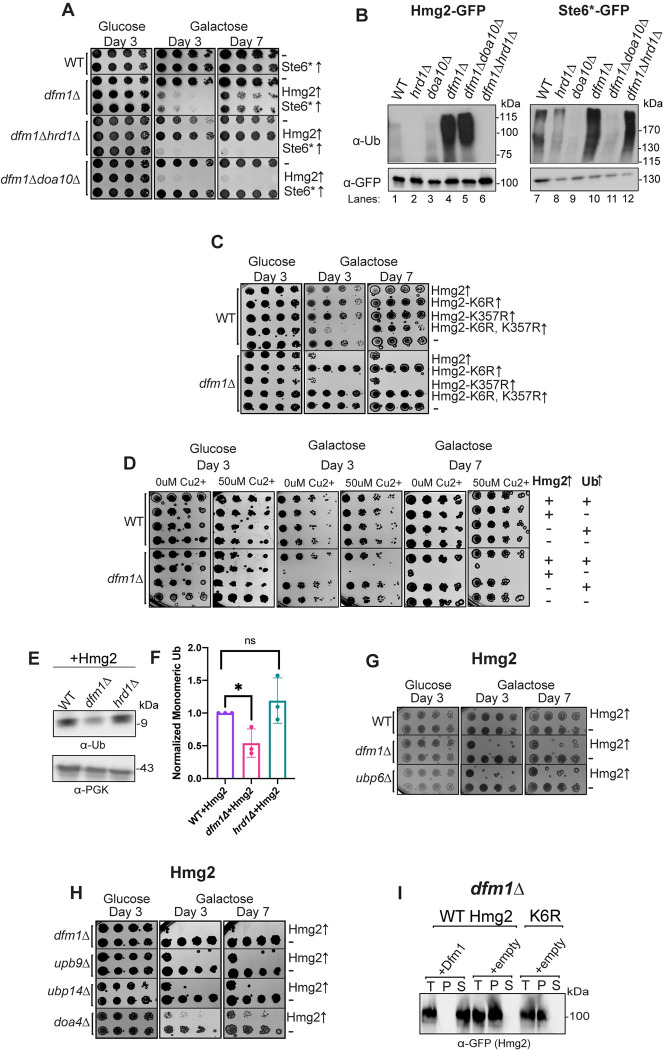
Fig 7. Ubiquitin stress contributes to misfolded membrane protein toxicity.
(A) WT, dfm1Δ, dfm1Δhrd1Δ, and dfm1Δdoa10Δ cells containing either GALpr-Hmg2-GFP, GALpr-STE6*-GFP, or EV were compared for growth by dilution assay. Each strain was spotted 5-fold dilutions on glucose or galactose-containing plates to drive Hmg2-GFP overexpression, and plates were incubated at 30°C. (B) Indicated strains expressing either Hmg2-GFP or Ste6*-GFP were grown to log-phase, lysed, and microsomes were collected and immunoprecipitated with α-GFP conjugated to agarose beads. Samples were then subjected to SDS-PAGE and immunoblotted by α-Ubiquitin and α-GFP. Three biological replicates (N = 3). (C) Dilution assay as described in (A) except using WT and dfm1Δ cells containing either GALpr-Hmg2-GFP, GALpr-Hmg2-K6R-GFP, GALpr-Hmg2-K357R-GFP, GALpr-Hmg2- (K6R and K357R)-GFP, or EV. (D) WT and dfm1Δ cells containing either CUP1pr-Ub or EV and GALpr-HMG2-GFP or EV were compared for growth by dilution assay. Each strain was spotted 5-fold dilutions on glucose or galactose-containing plates to drive Hmg2-GFP overexpression, and plates were incubated at 30°C. Galactose plates containing 50 μM Cu2+ were used to allow expression of Ub driven by the CUP1 promoter. (E) Western blot of monomeric ubiquitin in WT, dfm1Δ, and hrd1Δ expressing HMG2-GFP. Anti-ubiquitin was used to blot for ubiquitin and anti-PGK1 was used to blot for PGK1 as a loading control. (F) Quantification of western blots from (E). Each strain was normalized to PGK1 and the monomeric ubiquitin quantification of WT+HMG2-GFP was used to normalize all strains. (G) Dilution assay as described in (A) dfm1Δ, ubp9Δ, ubp14Δ, and doa4Δ cells. (H) Dilution assay as described in (A) except using WT, dfm1Δ, and ubp6Δ cells containing either GALpr-HMG2-GFP or EV. (I) Western blot of aggregated versus soluble membrane proteins at the ER. Lysates from dfm1Δ cells containing HMG2-GFP or HMG2-K6R-GFP with EV or DFM1-HA were blotted using anti-GFP to detect Hmg2. T is total fraction, P is pellet (ER aggregated) fraction, and S is soluble (ER non-aggregated) fraction. Data information: All dilution growth assays were performed in 3 biological replicates and 2 technical replicates (N = 3). For (F), all data are mean ± SEM, 3 biological replicates (N = 3); statistical significance is displayed as two-tailed unpaired t test, *P < 0.05, ns, not significant. Detergent solubility assay in (H) was performed with 3 biological replicates (N = 3). The data underlying this figure can be found in Table L in S1 Data (Sheet 3). ER, endoplasmic reticulum; EV, empty vector.

