. 2022 Sep 27;3(6):481–489. doi: 10.1158/2643-3230.BCD-22-0077

Figure 3.

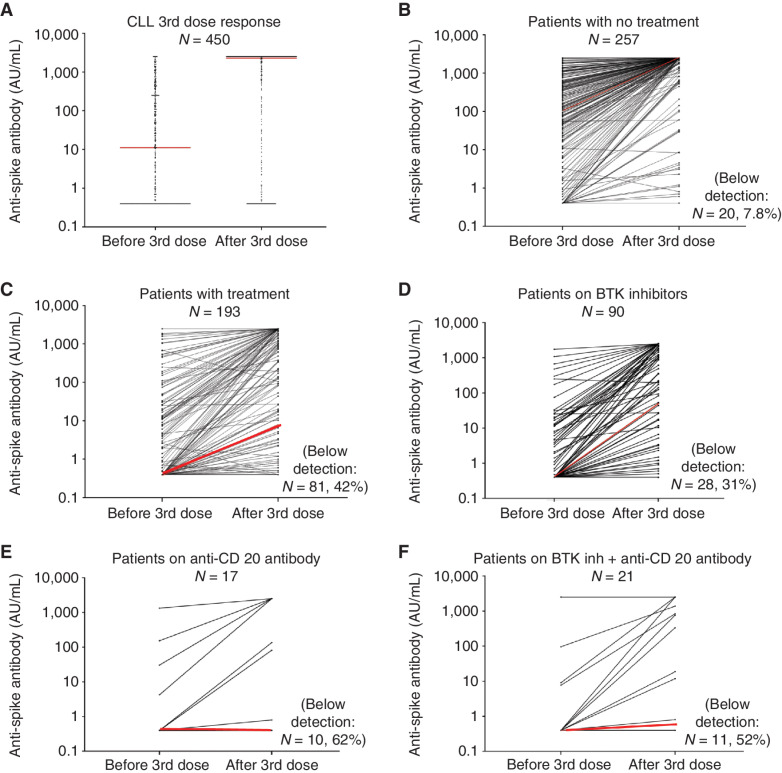
Figure 3. The anti-S antibody level in CLL patients was assessed as described in the Methods. Overall response in patients (A); individual dots represent each patient. Response of individual patients before and after the third vaccination for patients on treatment (B) or no treatment (C). Patients treated with BTK inhibitors (D), anti-CD20 antibodies (E), or a combination (F) are shown. Individual lines represent each patient (B–E). Red lines indicate the median response.

The anti-S antibody level in CLL patients was assessed as described in the Methods. Overall response in patients (A); individual dots represent each patient. Response of individual patients before and after the third vaccination for patients with no treatment (B) or treatment (C). Patients treated with BTK inhibitors (D), anti-CD20 antibodies (E), or a combination (F) are shown. Individual lines represent each patient (B–E). Red lines indicate the median response.