Figure 1.
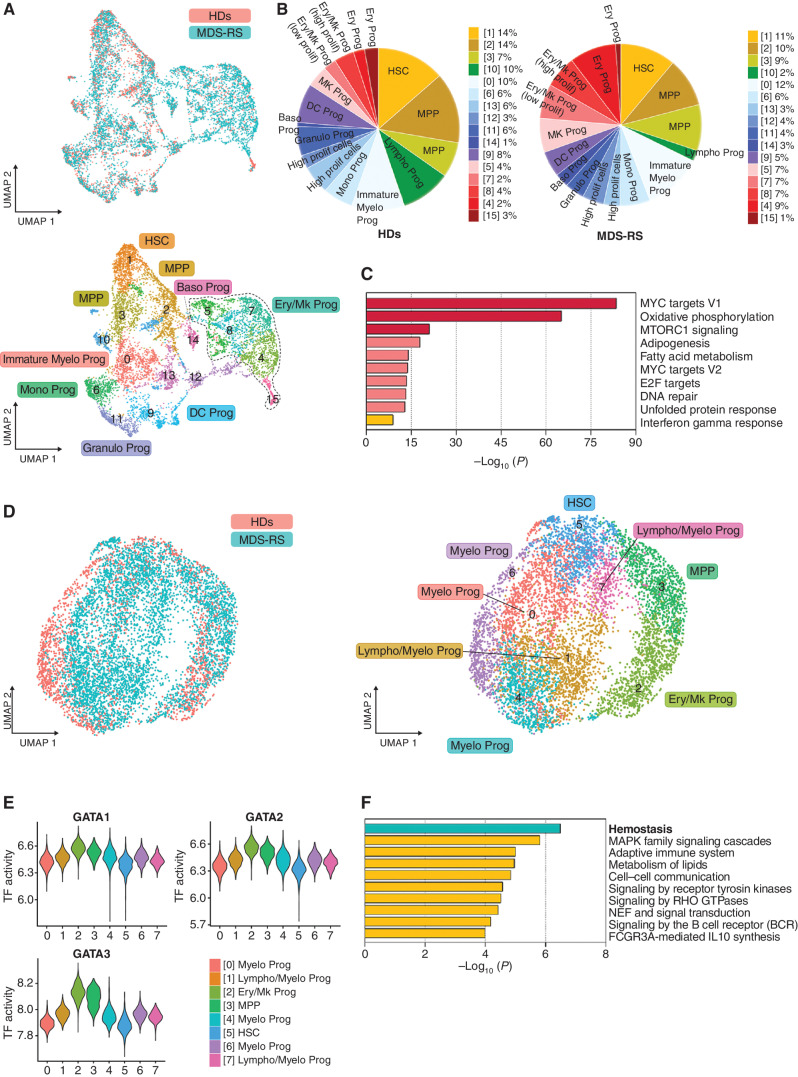
SF3B1 MT do not impair erythropoiesis at the level of HSPCs. A, UMAP plots of scRNA-seq data displaying pooled single Lin−CD34+ cells isolated from two HD (n = 2,324) and five SF3B1-mutant MDS-RS (n = 5,544) samples. Each dot represents one cell. Different colors represent the sample origin (top) and cluster identity (bottom). B, Distribution of HD (left) and MDS-RS (right) Lin−CD34+ cells among the clusters shown in A defined by distinct lineage differentiation profiles. Prolif, proliferative. C, Pathway enrichment analysis of the genes that were significantly upregulated in the MDS-RS Ery/Mk clusters as compared with the HD Ery/Mk clusters shown in A (adjusted P ≤ 0.05). The top 10 Hallmark gene sets are shown. D, UMAP plots of scATAC-seq data for pooled Lin−CD34+ cells isolated from 2 HD (n = 1,844) and 3 SF3B1-mutant MDS-RS (n = 5,203) samples. Each dot represents one cell. Different colors represent the sample origin (left) and cluster identity (right). E, Violin plots showing the activities of the TFs GATA1, GATA2, and GATA3 across the 8 clusters shown in D. F, Pathway enrichment analysis of the genes whose distal elements were enriched in open chromatin regions in HD cells from cluster 2 shown in D as compared with those of MDS-RS cells (adjusted P ≤ 0.05). The top 10 Reactome gene sets are shown. Baso, basophilic; DC, dendritic cell; Ery/Mk, erythroid/megakaryocytic; Granulo, granulocytic; HSC, hematopoietic stem cells; Mono, monocytic; MPP, multipotent progenitors; Myelo, myeloid; Prog, progenitors; UMAP, uniform manifold approximation and projection.

