. 2022 Aug 3;3(6):554–567. doi: 10.1158/2643-3230.BCD-21-0220

Figure 2.

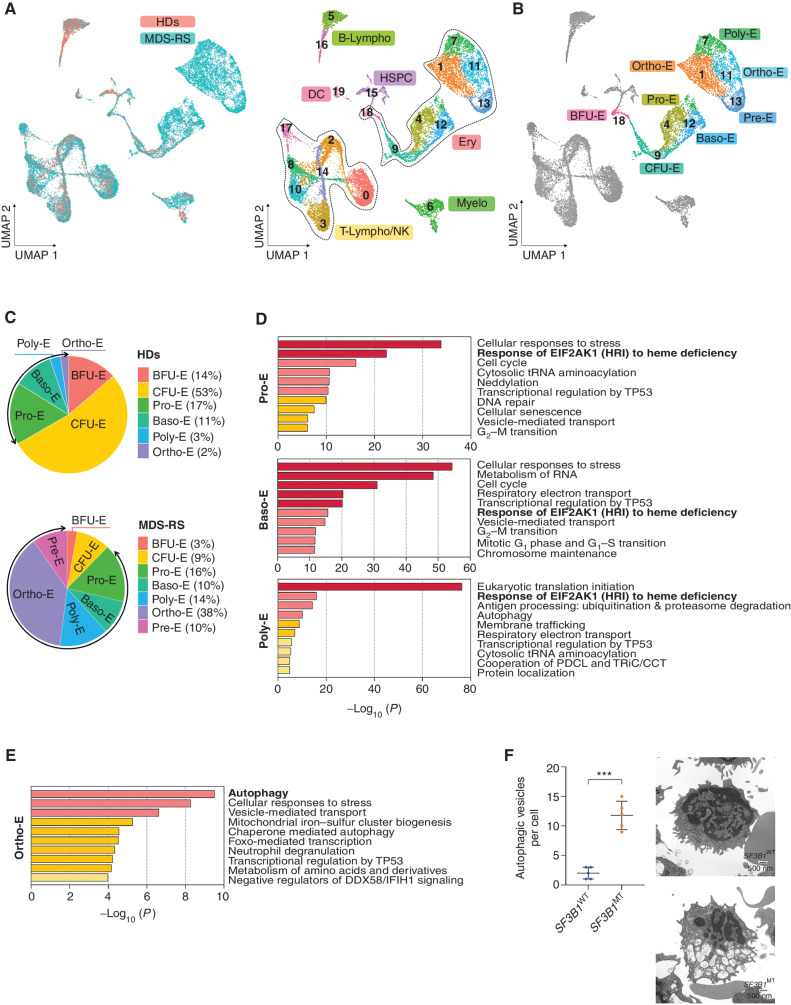
Figure 2. SF3B1MT arrest erythroid terminal differentiation and activate the EIF2AK1-induced response pathway to heme deficiency. A, UMAP plots of scRNA-seq data for pooled single MNCs isolated from two HD (n = 5,049) and five SF3B1-mutant MDS-RS (n = 16,212) samples. Each dot represents one cell. Different colors represent the sample origin (left) and cluster identity (right). B, UMAP plot of scRNA-seq data from A showing the 7 different stages of erythroid differentiation in the total erythroblast population. C, Distribution of the 7 stages of erythroid differentiation in the HD (top) and MDS-RS (bottom) erythroblast populations shown in A. Arrows indicate the terminal steps of erythroid differentiation. D, Pathway enrichment analyses of the genes that were significantly upregulated in Pro-E (top), Baso-E (middle), Poly-E (bottom) from MDS-RS samples as compared with those from HD samples (P ≤ 0.01) The top 10 Reactome gene sets are shown. E, Pathway enrichment analysis of the genes that were significantly upregulated in Ortho-E from MDS-RS samples as compared with those from HD samples (P ≤ 0.01) The top 10 Reactome gene sets are shown. F, Left, the number of autophagic vesicles per cell in SF3B1WT and SF3B1-mutant erythroblasts from one representative SF3B1WT and one SF3B1-mutant sample. Statistically significant differences were detected using a two-tailed Student t test. Right, representative transmission electron microscopy images of erythroblasts from the BM sections of one SF3B1WT and one SF3B1-mutant MDS sample. Scale bars, 500 nm. Baso-E, basophilic erythroblasts; BFU-E, burst-forming unit-erythroid cells; B-Lympho, B-lymphocytes; CFU-E, colony formation unit-erythroid cells; DC, dendritic cells; Ery, erythroblasts; HSPC, hematopoietic stem and progenitor cells; Myelo, myeloid cells; Ortho-E, orthochromatic erythroblasts; Poly-E, polychromatophilic erythroblasts; Pre-E, pre-erythrocytes; Pro-E, pro-erythroblasts; T-Lympho/NK, T-lymphocytes, and natural killer cells; UMAP, uniform manifold approximation and projection.

SF3B1 MT arrest erythroid terminal differentiation and activate the EIF2AK1-induced response pathway to heme deficiency. A, UMAP plots of scRNA-seq data for pooled single MNCs isolated from two HD (n = 5,049) and five SF3B1-mutant MDS-RS (n = 16,212) samples. Each dot represents one cell. Different colors represent the sample origin (left) and cluster identity (right). B, UMAP plot of scRNA-seq data from A showing the 7 different stages of erythroid differentiation in the total erythroblast population. C, Distribution of the 7 stages of erythroid differentiation in the HD (top) and MDS-RS (bottom) erythroblast populations shown in A. Arrows indicate the terminal steps of erythroid differentiation. D, Pathway enrichment analyses of the genes that were significantly upregulated in Pro-E (top), Baso-E (middle), Poly-E (bottom) from MDS-RS samples as compared with those from HD samples (P ≤ 0.01) The top 10 Reactome gene sets are shown. E, Pathway enrichment analysis of the genes that were significantly upregulated in Ortho-E from MDS-RS samples as compared with those from HD samples (P ≤ 0.01) The top 10 Reactome gene sets are shown. F, Left, the number of autophagic vesicles per cell in SF3B1WT and SF3B1-mutant erythroblasts from one representative SF3B1WT and one SF3B1-mutant sample. Statistically significant differences were detected using a two-tailed Student t test. Right, representative transmission electron microscopy images of erythroblasts from the BM sections of one SF3B1WT and one SF3B1-mutant MDS sample. Scale bars, 500 nm. Baso-E, basophilic erythroblasts; BFU-E, burst-forming unit-erythroid cells; B-Lympho, B-lymphocytes; CFU-E, colony formation unit-erythroid cells; DC, dendritic cells; Ery, erythroblasts; HSPC, hematopoietic stem and progenitor cells; Myelo, myeloid cells; Ortho-E, orthochromatic erythroblasts; Poly-E, polychromatophilic erythroblasts; Pre-E, pre-erythrocytes; Pro-E, pro-erythroblasts; T-Lympho/NK, T-lymphocytes, and natural killer cells; UMAP, uniform manifold approximation and projection.