. 2022 Aug 3;3(6):554–567. doi: 10.1158/2643-3230.BCD-21-0220

Figure 3.

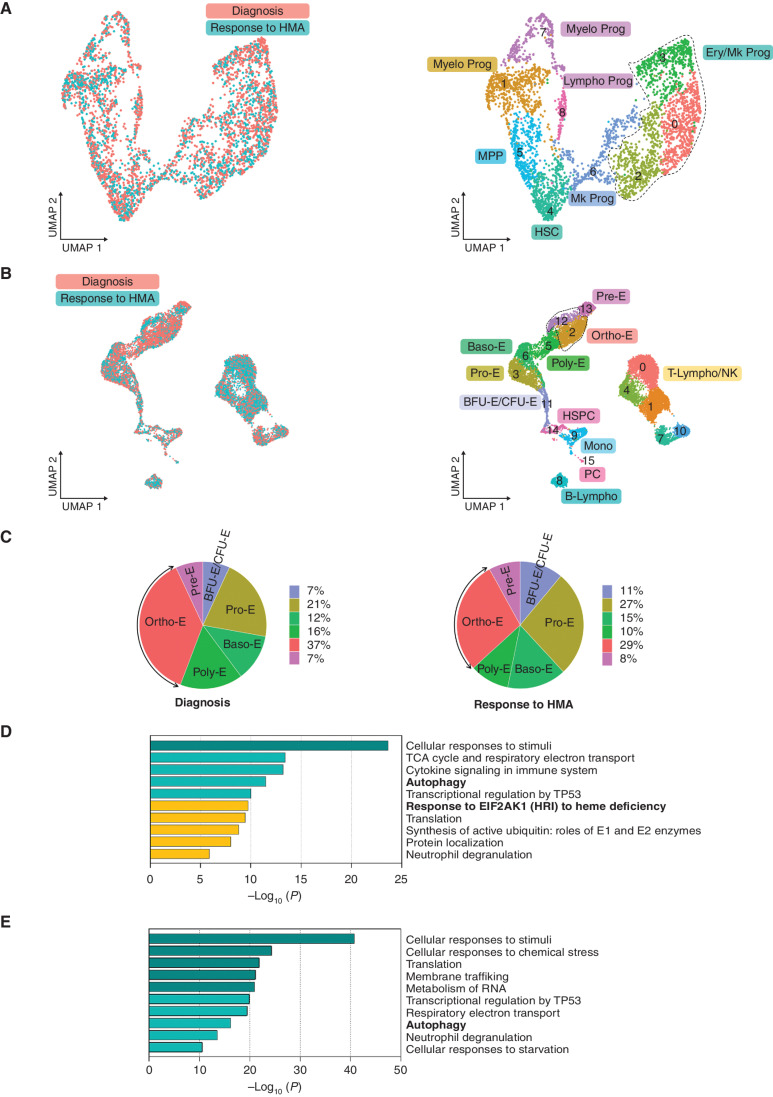
Figure 3. Hypomethylating agent therapy inhibits the EIF2AK1-induced response pathway to heme deficiency in terminally differentiated cells in patients who became transfusion independent. A, UMAP plots of scRNA-seq data for pooled single Lin-CD34+ cells isolated from two SF3B1-mutant MDS-RS patients at the time of diagnosis (n = 2,372) and at the time of response to HMA therapy (n = 1,551). Each dot represents one cell. Different colors represent the sample origin (left) and cluster identity (right). B, UMAP plots of scRNA-seq data for pooled single MNCs isolated from three SF3B1-mutant MDS-RS patients at the time of diagnosis (n = 6,089) and response to HMA therapy (n = 6,156). Each dot represents one cell. Different colors represent the sample origin (left) and cluster identity (right). C, Distribution of the stages of erythroid differentiation in the total erythroblast population shown in B at the time of diagnosis (left) and at the time of response to HMA therapy (right). Arrows indicate Ortho-E. D, Pathway enrichment analysis of the genes in the MDS-RS Pro-E, Baso-E, and Poly-E clusters shown B that were significantly downregulated at the time of response to HMA therapy as compared with the time of diagnosis (adjusted P ≤ 0.05). The top 10 Reactome gene sets are shown. E, Pathway enrichment analysis of the genes in the MDS-RS Ortho-E shown in B that were significantly downregulated at the time of response to HMA therapy as compared with the time of diagnosis (P ≤ 0.01). The top 10 Reactome gene sets are shown. Baso-E, basophilic erythroblasts; BFU-E, burst-forming unit-erythroid cells; B-Lympho, B-lymphocytes; CFU-E, colony formation unit-erythroid cells; Ery/Mk, erythroid/megakaryocytic; HSC, hematopoietic stem cells; HSPC, hematopoietic stem and progenitor cells; Lympho, lymphoid; Mk, megakaryocytic; Mono, monocytes; MPP, multipotent progenitors; Myelo, myeloid; NK, natural killer cells; Ortho-E, orthochromatic erythroblasts; PC, plasma cells; Poly-E, polychromatophilic erythroblasts; Pre-E, pre-erythrocytes; Pro-E, pro-erythroblasts; Prog, progenitors; T-Lympho, T-lymphocytes; UMAP, uniform manifold approximation and projection.

Hypomethylating agent therapy inhibits the EIF2AK1-induced response pathway to heme deficiency in terminally differentiated cells in patients who became transfusion independent. A, UMAP plots of scRNA-seq data for pooled single Lin-CD34+ cells isolated from two SF3B1-mutant MDS-RS patients at the time of diagnosis (n = 2,372) and at the time of response to HMA therapy (n = 1,551). Each dot represents one cell. Different colors represent the sample origin (left) and cluster identity (right). B, UMAP plots of scRNA-seq data for pooled single MNCs isolated from three SF3B1-mutant MDS-RS patients at the time of diagnosis (n = 6,089) and response to HMA therapy (n = 6,156). Each dot represents one cell. Different colors represent the sample origin (left) and cluster identity (right). C, Distribution of the stages of erythroid differentiation in the total erythroblast population shown in B at the time of diagnosis (left) and at the time of response to HMA therapy (right). Arrows indicate Ortho-E. D, Pathway enrichment analysis of the genes in the MDS-RS Pro-E, Baso-E, and Poly-E clusters shown B that were significantly downregulated at the time of response to HMA therapy as compared with the time of diagnosis (adjusted P ≤ 0.05). The top 10 Reactome gene sets are shown. E, Pathway enrichment analysis of the genes in the MDS-RS Ortho-E shown in B that were significantly downregulated at the time of response to HMA therapy as compared with the time of diagnosis (P ≤ 0.01). The top 10 Reactome gene sets are shown. Baso-E, basophilic erythroblasts; BFU-E, burst-forming unit-erythroid cells; B-Lympho, B-lymphocytes; CFU-E, colony formation unit-erythroid cells; Ery/Mk, erythroid/megakaryocytic; HSC, hematopoietic stem cells; HSPC, hematopoietic stem and progenitor cells; Lympho, lymphoid; Mk, megakaryocytic; Mono, monocytes; MPP, multipotent progenitors; Myelo, myeloid; NK, natural killer cells; Ortho-E, orthochromatic erythroblasts; PC, plasma cells; Poly-E, polychromatophilic erythroblasts; Pre-E, pre-erythrocytes; Pro-E, pro-erythroblasts; Prog, progenitors; T-Lympho, T-lymphocytes; UMAP, uniform manifold approximation and projection.